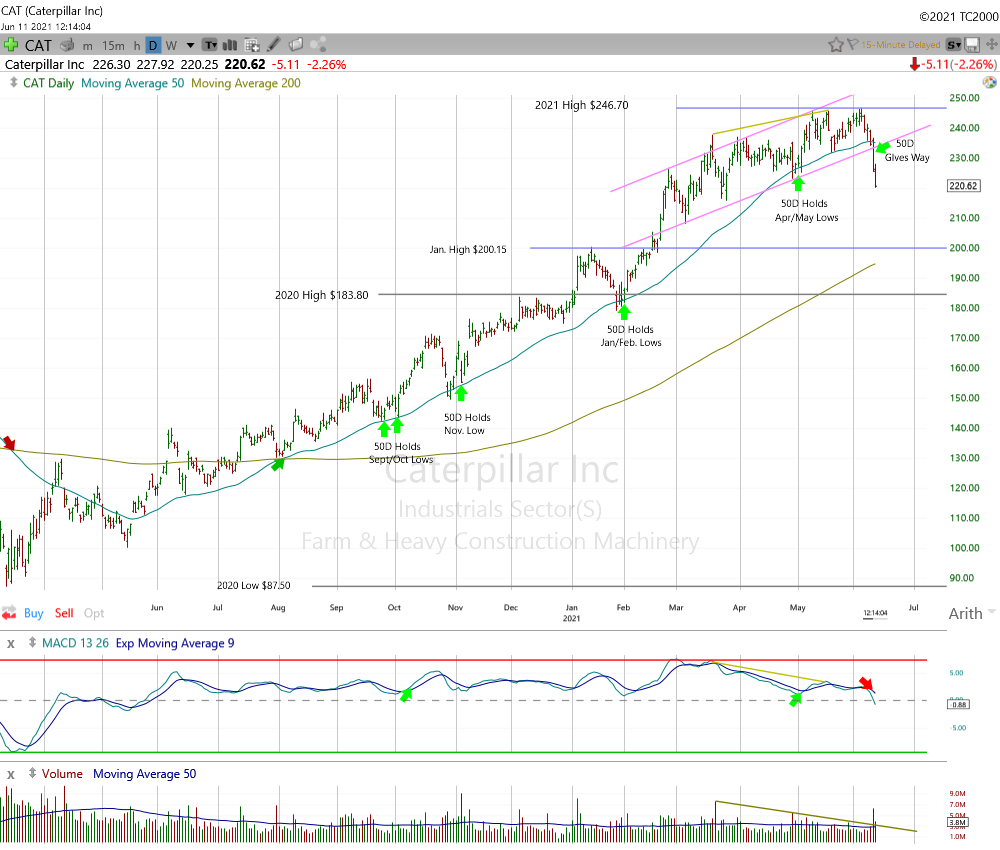
Caterpillar (NYSE:) is under heavy pressure as the week comes to an end. On Thursday, shares fell 3.8% with the help of a big bump in volume. This damaging breakdown pierced a key trendline that had linked the March/April lows. The 50-day moving average, which has provided solid support since September, also gave way under this extreme selling pressure. CAT is off another 2.3% today as it dips below the April and May lows. This is quite a reversal of the action earlier this month when the stock put in a new high for the year.
We expect more downside in the near term. Initial support is near $200 (January high). The 200-day moving average, which has not been tested since the early August ‘Golden Cross,” is just below and is trending higher. A week from now the 200-day will be approximately $196.50.
Note: We have no position.
You can read Gary S. Morrow’s original post here.
Fusion Media or anyone involved with Fusion Media will not accept any liability for loss or damage as a result of reliance on the information including data, quotes, charts and buy/sell signals contained within this website. Please be fully informed regarding the risks and costs associated with trading the financial markets, it is one of the riskiest investment forms possible.

