It was Mar. 19, 2020, and the world appeared to be coming to an end. Governments around the globe were rushing to impose lockdowns to curb the spread of COVID-19. The entire world economy was suddenly stopped in its tracks. U.S. stocks suffered their fastest fall into a bear market in history, down over 35% in just a month. Yet, against that backdrop, we thought stocks were starting to look promising. One company we examined was SEI Investments (NASDAQ:).
This was actually the second time we analyzed the charts of SEI Investments. The first time was on Nov. 5, 2019, when Elliott Wave analysis helped us predict the upcoming selloff. In March 2020, however, with the stock already down 42% in a month, it was time to take another look.
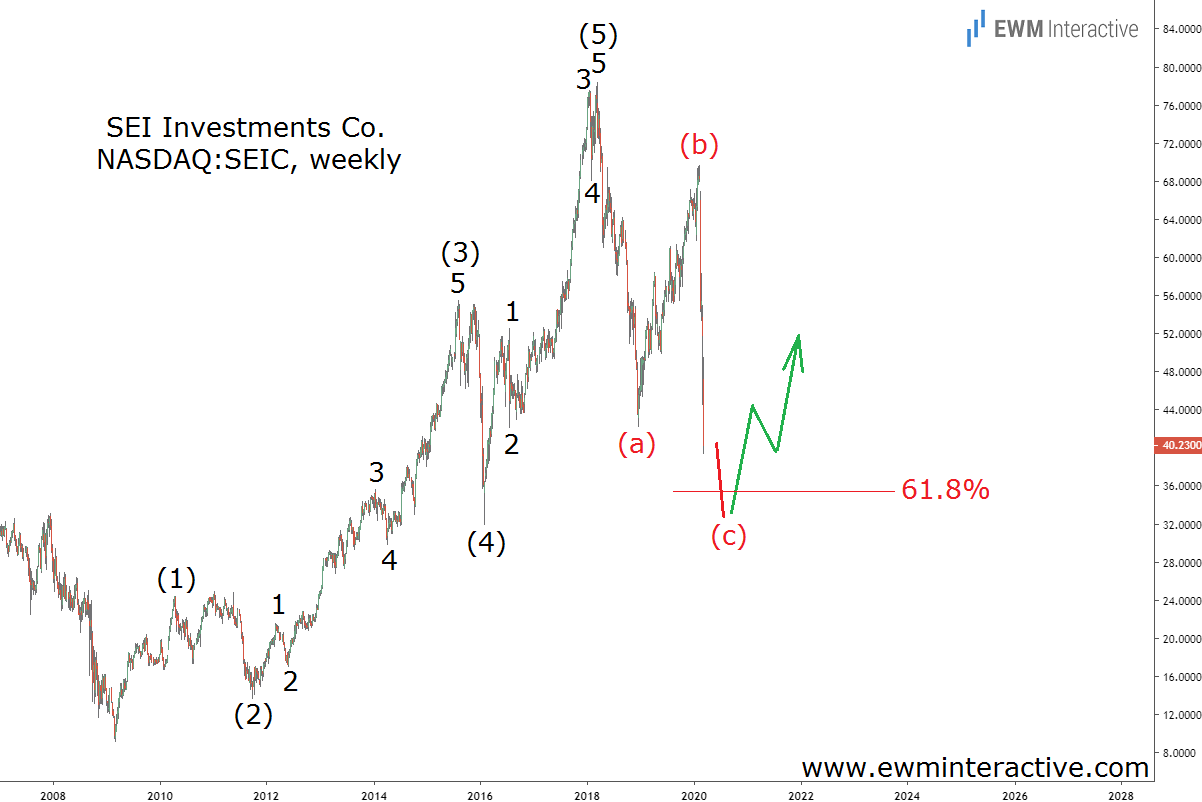
This was the chart we shared with our readers while the coronavirus crash was in full swing. It showed that SEIC stock was on the verge of completing the bullish Elliott Wave cycle it began in 2009. The pattern consisted of a five-wave impulse labeled (1)-(2)-(3)-(4)-(5) and a three-wave correction marked (a)-(b)-(c).
SEI Investments Crash Ended at a Fibonacci Support Level
Wave (c) was already approaching the 61.8% Fibonacci support. The theory states that once a correction is over the preceding trend resumes. So, we thought a bullish reversal could soon be expected. The updated chart below shows what happened next.
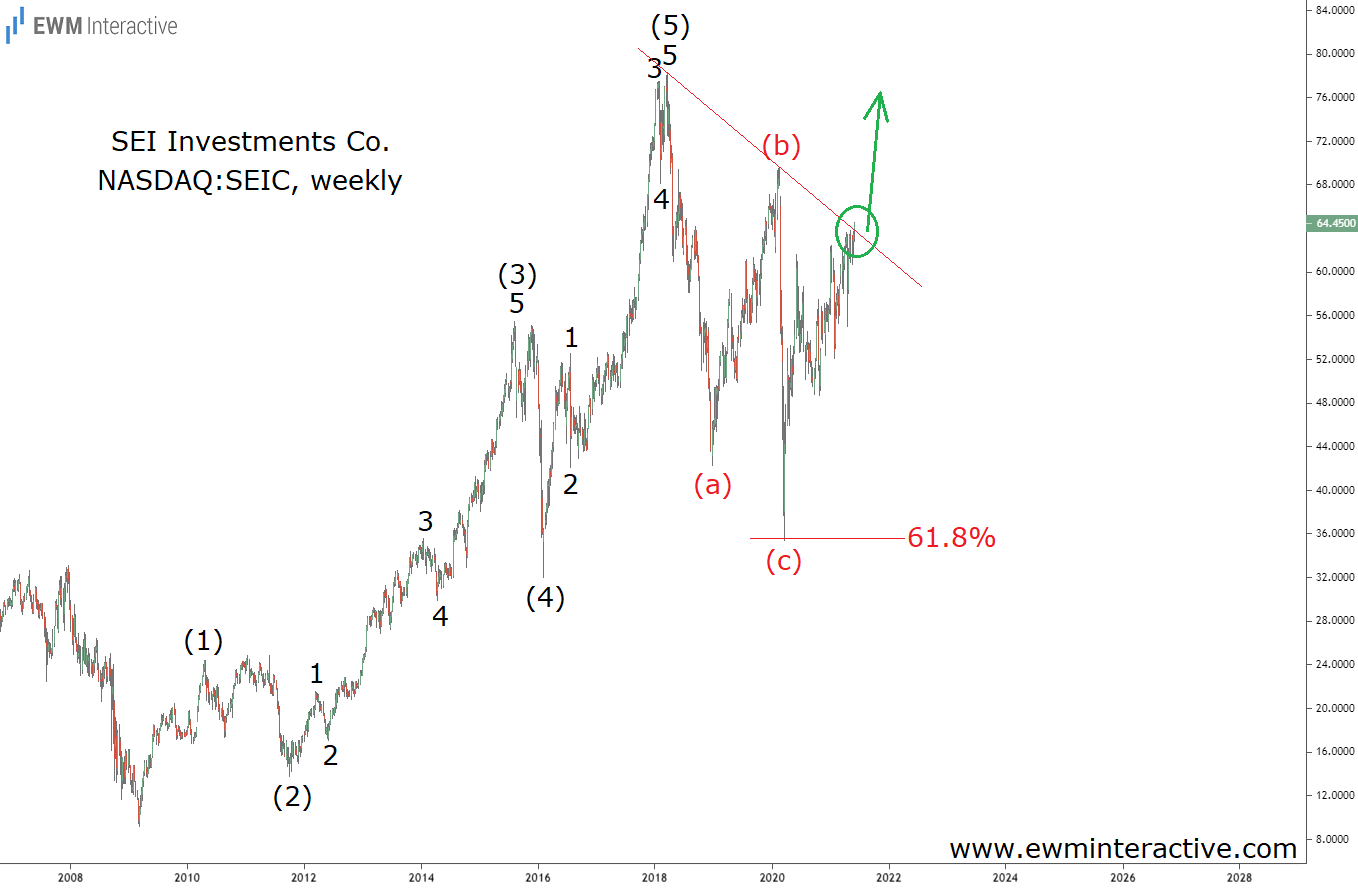
For SEI Investments, the COVID crash ended precisely at the 61.8% Fibonacci level. The bears could not drag the price lower than $35.40 a share on Mar. 23, 2020. Less than fifteen months later now, SEIC is up over 80% and is on the verge of a major bullish breakout.
We think the bulls are back and their initial targets lie above the top of wave (5). This means SEIC can not only breach the (5)-(b) resistance line, but keep climbing towards a new record above $80 a share. Given the high quality of the business, we feel confident enough to see it through.
Disclosure: The author holds a long position in SEIC stock.
Fusion Media or anyone involved with Fusion Media will not accept any liability for loss or damage as a result of reliance on the information including data, quotes, charts and buy/sell signals contained within this website. Please be fully informed regarding the risks and costs associated with trading the financial markets, it is one of the riskiest investment forms possible.


