- Price action stalls at all time highs
- Delta variant causing concerns
- Big divergence in breadth
- Seasonal volatility problems

Market action is decidedly negative as we start the week of trade with European indices off by as much as -2% while US stock index futures are down between 40 and 90 basis points.
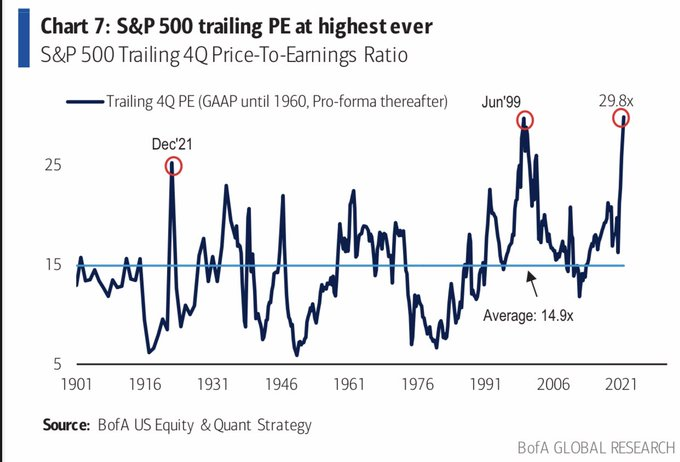
Although stocks remain near all time highs there is good reason to believe that we may see a correction over the next few months as investor enthusiasm about the recovery begins to subside.
There is no doubt that growth in G-10 is expected to rebound strongly in H2 of 2021 as the broad threat of the pandemic recedes. However the lofty expectations are already baked into equity prices which remain at near record valuations and would require even faster growth to justify current pricing.
Delta variant causing concerns
Meanwhile, the Delta variant is wreaking havoc as it’s infectivity rate and viral loads far exceed former versions of the virus. Although President Joseph Biden is correct in stating that the pandemic remains a threat only to the unvaccinated, the fact of the matter is that nearly half the US population is not yet fully vaccinated and is at risk of this disease for the time being. The Delta threat has also forced many governments into new travel restrictions tempering the great rebound in tourism that the market priced in.
On the economic front, the spike in —whether it be temporary or not—is clearly weighing on Consumer Sentiment with U of M data showing a drop to from 86.5.
Purchasing attitudes towards homes and cars have declined to lowest levels since 1982, as rising prices clearly impact affordability, and although rose slightly more than expected, as many analysts have pointed out, the actual volume of goods sold declined suggesting that much of the gains were due to price rises.
Big divergence in breadth
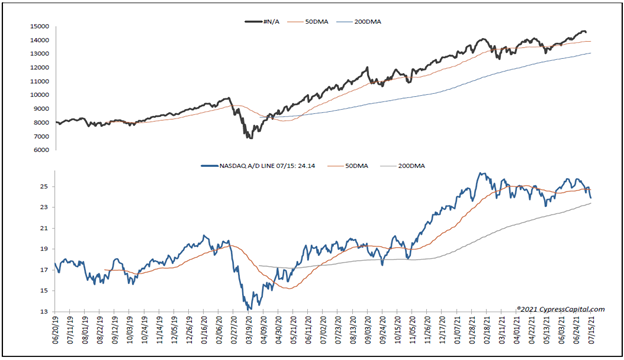
Technically, the price action in equities has been highly concentrated in the top capitalization names while the broader markets have lagged. This is particularly true of the , where the mega caps have been responsible for almost all the recent gains, while the cumulative advance decline ratio has dipped below the 50 SMA.

50 DMA And 200 DMA Chart
Seasonal volatility problems
August can often be a high volatility month for equities as investors, often lulled by the sandy beaches of St. Tropez and the Hamptons, are unprepared for the violent price action. It’s impossible to predict the catalyst for a correction and prices could slide just on profit taking alone, but it may be prudent to hedge exposure now while volatility remains relatively tame.
The QQQ 350/340 September 30 Put Spread is trading at around 3.5 pricing in only a 35% chance of a 5% decline in the NASDAQ. That may be too optimistic and offers the prospect of a 6.5 payout for 3.5 cost that could pay off if sentiment turns jittery into the end of summer.

