Stocks gapped higher yesterday, and after a strong overnight session in the futures, markets traded sideways the rest of the day. It shouldn’t have been too much of a surprise, given it was a Monday. Interestingly, it was not as strong as it appeared on the surface. That’s because it took Apple (NASDAQ:AAPL), Amazon (NASDAQ:AMZN), Microsoft (NASDAQ:MSFT), and Facebook (NASDAQ:FB) having strong days to lift the indexes. But that’s been the story for the whole year.
S&P 500
Technically, the S&P 500 ETF may tell the story the best because despite the S&P 500 index reaching a new high, the ETF did not. It seems strange, but it didn’t, and so until the SPY ETF breaks out, I’m going hold back calling a market break out or making adjustments to my targets.
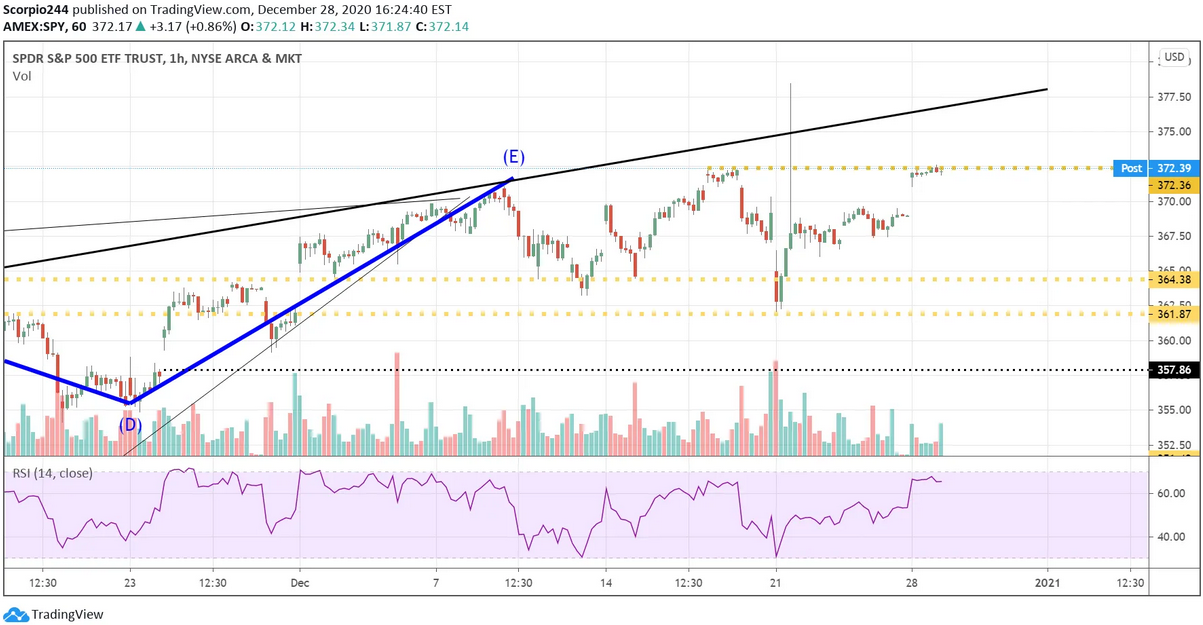 SPDR S&P 500 ETF Chart
NASDAQ
The NASDAQ 100 futures also have a rather concise pattern, which seems to show the same rising wedge as in the S&P 500. So, unfortunately, this will have to wait until tomorrow to see what happens next.
It also doesn’t help when the VIX rises on a day that the markets are up. It is counterintuitive and suggests there is a high degree of fear lurking around.
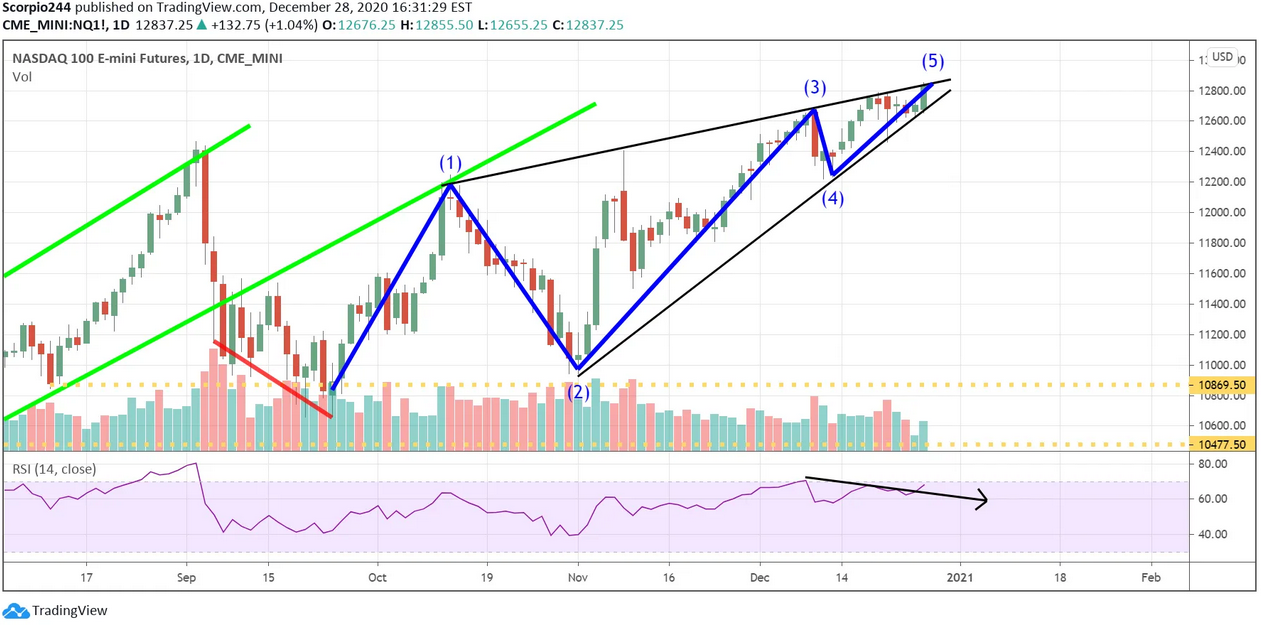 NASDAQ 100 Emini Futures Daily Chart
Dollar Index
The dollar index had a nice reversal yesterday to finish higher. The dollar index is sitting below resistance around 90.40. It is at a much watch level. A rising dollar would be bearish for gold and other metals.
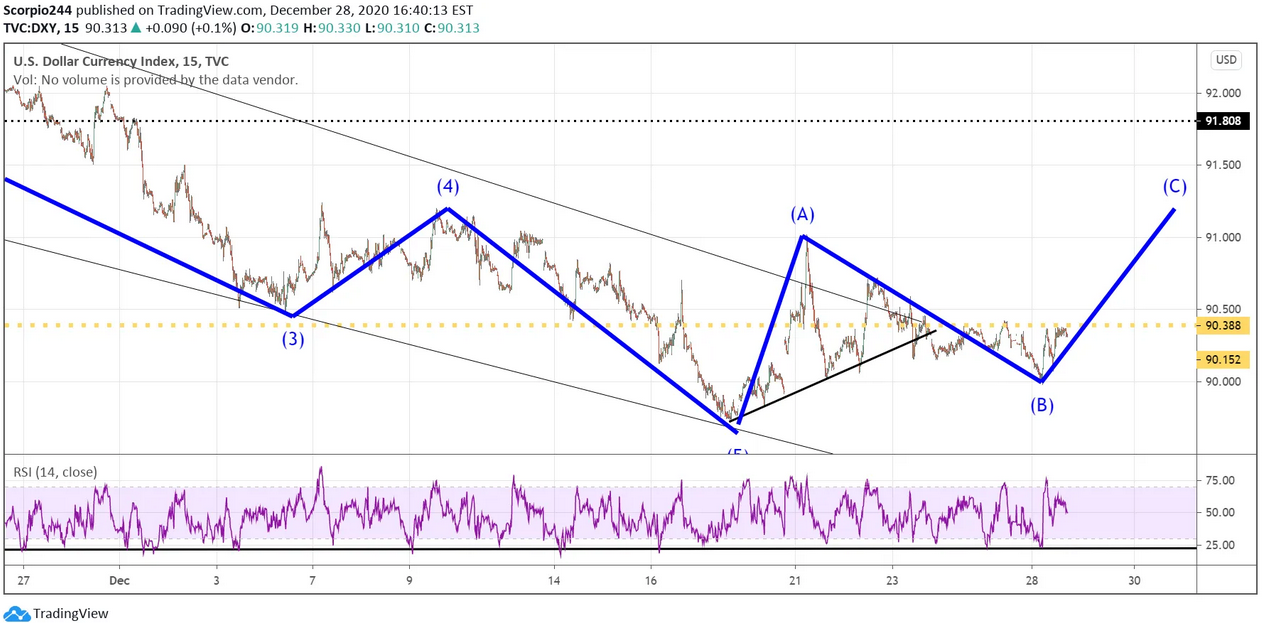 USD Index Chart
Apple
Apple had a good day yesterday, but I still tend to think it heads back to $124, maybe not tomorrow, but perhaps sometime next week. The stock is approaching its prior highs, which means its multiples are getting stretched again, and from a technical standpoint, the stock is overbought.
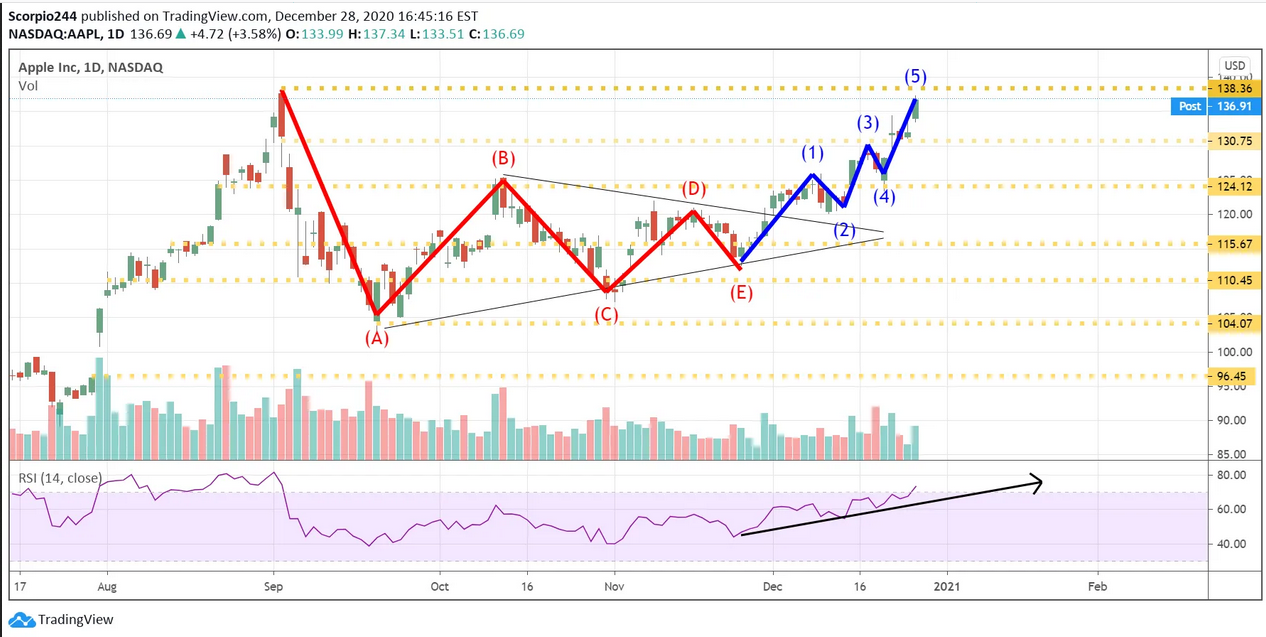 Apple Inc Daily Chart
Amazon
Amazon clearly went the wrong way, and I couldn’t begin to explain why. Perhaps it means the market thinks stimulus money gets spent on Amazon. Perhaps it is just an end of year rotation into quality. I don’t know. But the move was sharp, and on good volume, so this one bothers me more than the Apple move. For now, I’m leaving my thoughts of it falling over the short-term to around $2,870 unchanged. We will see what happens tomorrow.
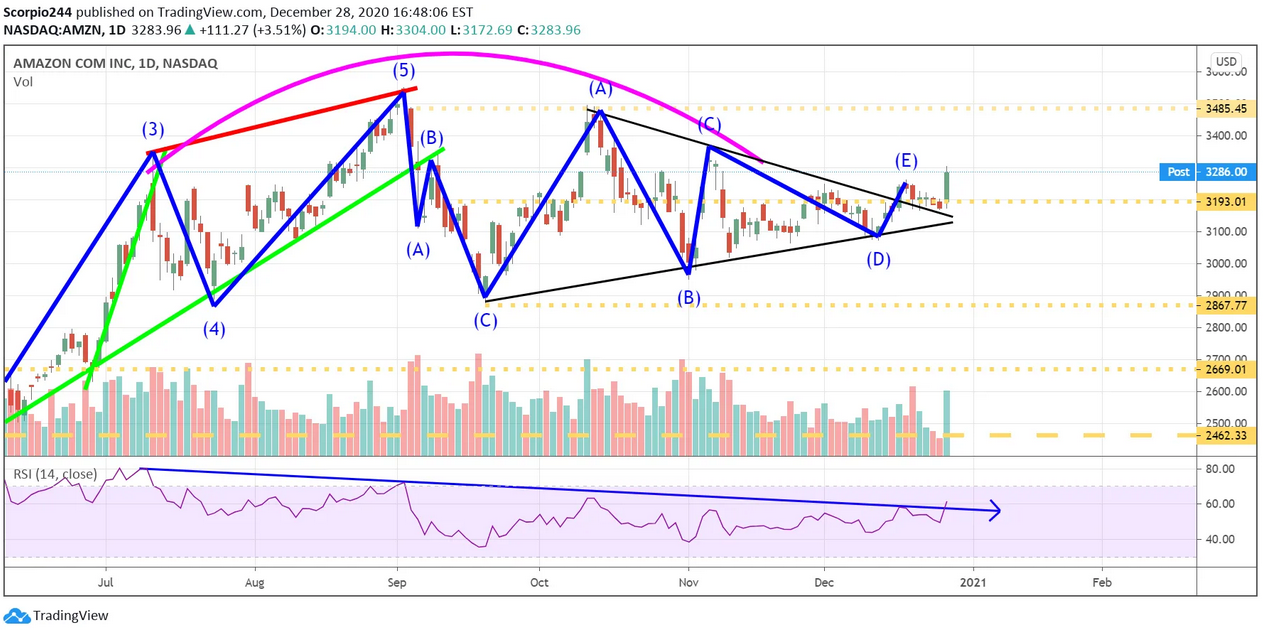 Amazon.com Daily Chart
Lemonade
Not a good day for Lemonade; it has many of the same characteristics as Fubo. The lock-up expiration date is tomorrow, implied volatility is extremely high, and so is the borrow rate. I talked about this and why I think the stock is likely to head back to $80.
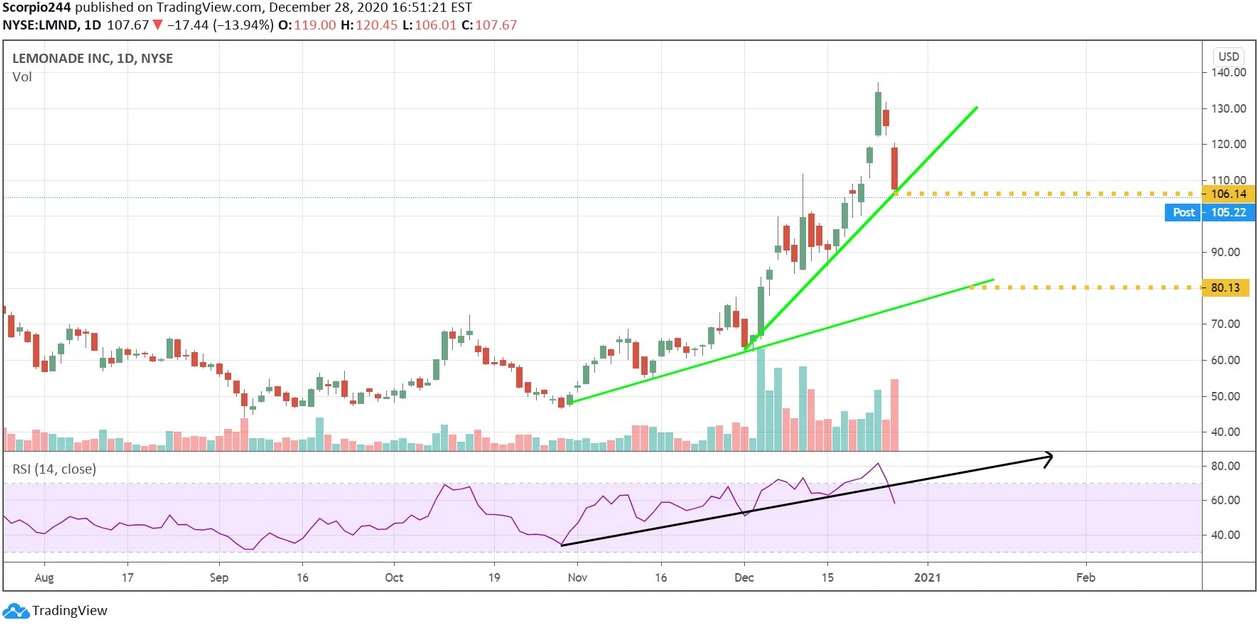 Lemonade Inc Daily Chart
Zoom
Zoom was crushed yesterday, falling another 6%. The stock appears to be unwinding, and it may get worse before it gets better. There may be shareholders that are either seeing their big gains melt away and now want to lock them in. Or, there may be shareholders that bought at higher prices and are taking losses. Either way, it means there is probably a lot of stock that is still for sale. A break of support at $349 sends it to that $325 level we have been talking about for months.
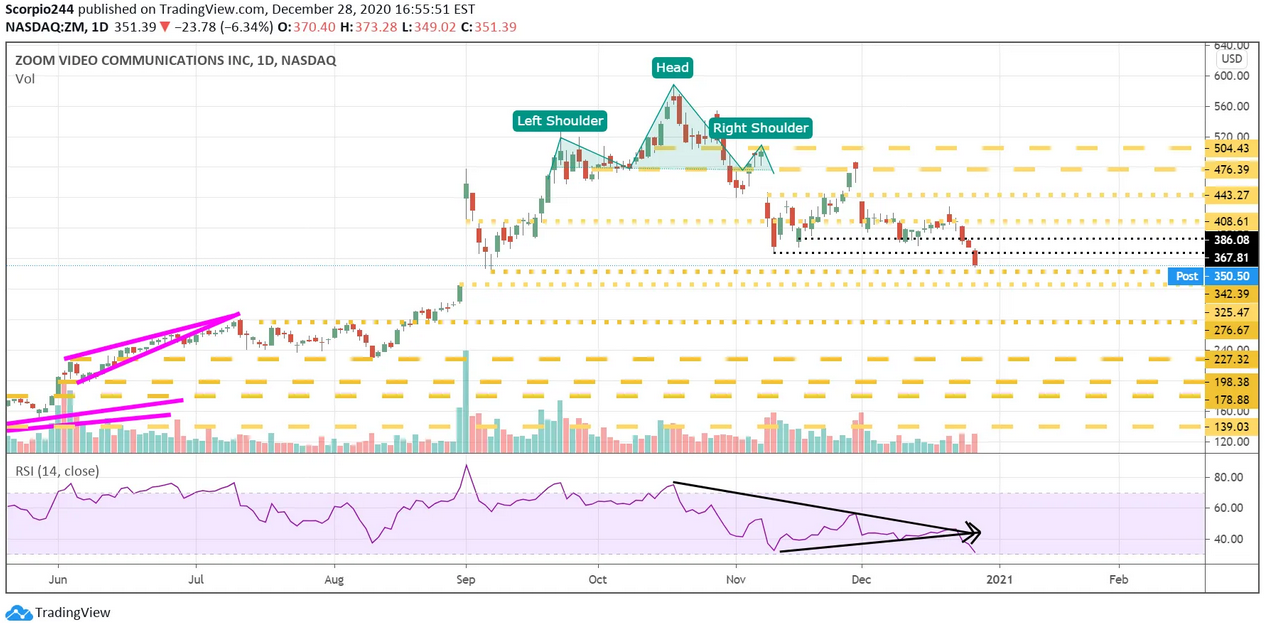 Zoom Video Daily Chart
Roku
Did the bump and run pattern of the bump and run pattern in Roku (NASDAQ:ROKU) finally break? Maybe, I will be watching this one really close.
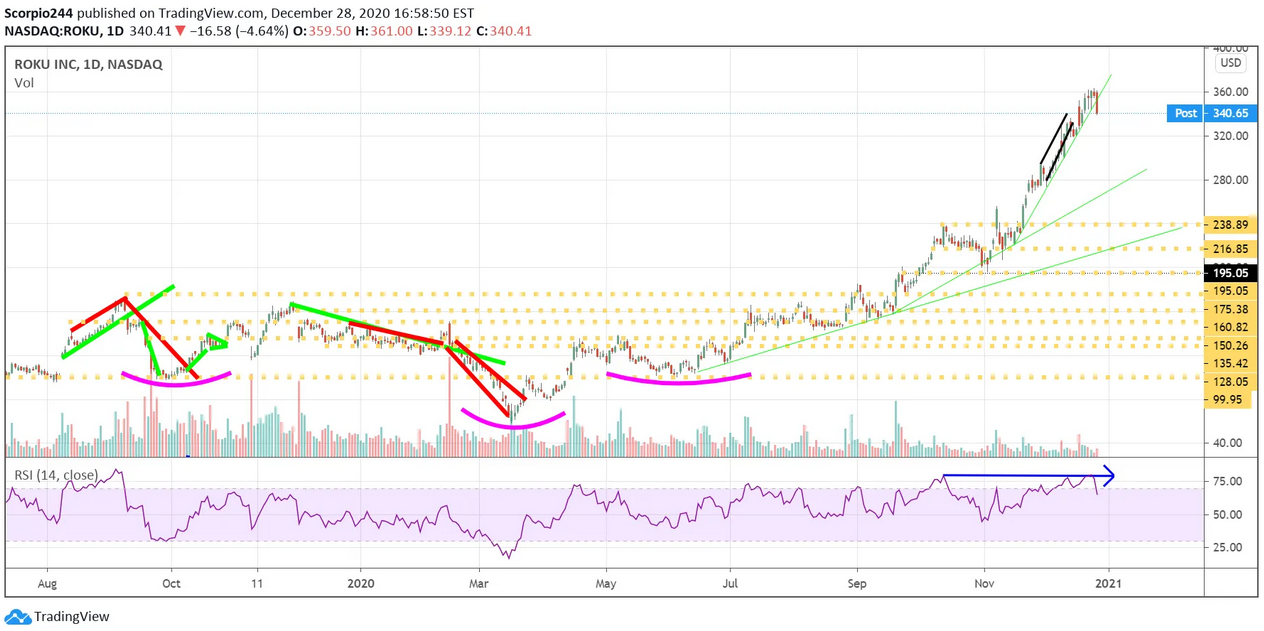 Roku Inc Daily Chart
Visa
Visa (NYSE:V) may be one stock to ready to break out based on the chart; it looks like a potential pennant pattern forming. Maybe it can finally catch-up to PayPal and Square.
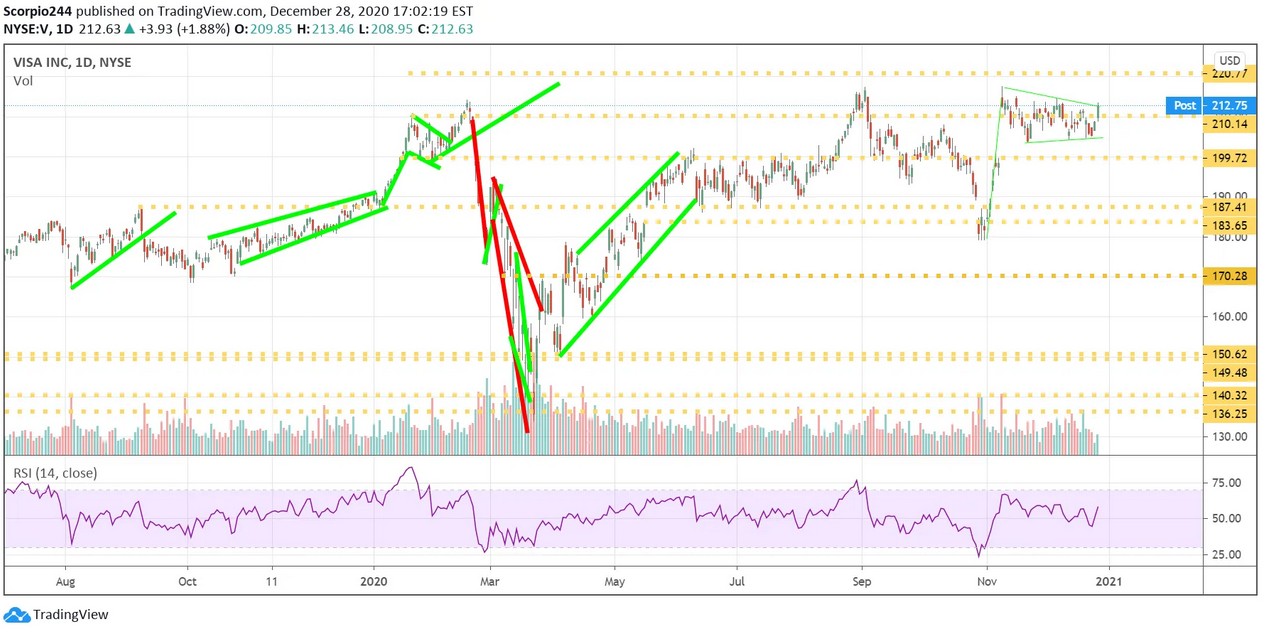 VISA Inc Daily Chart
