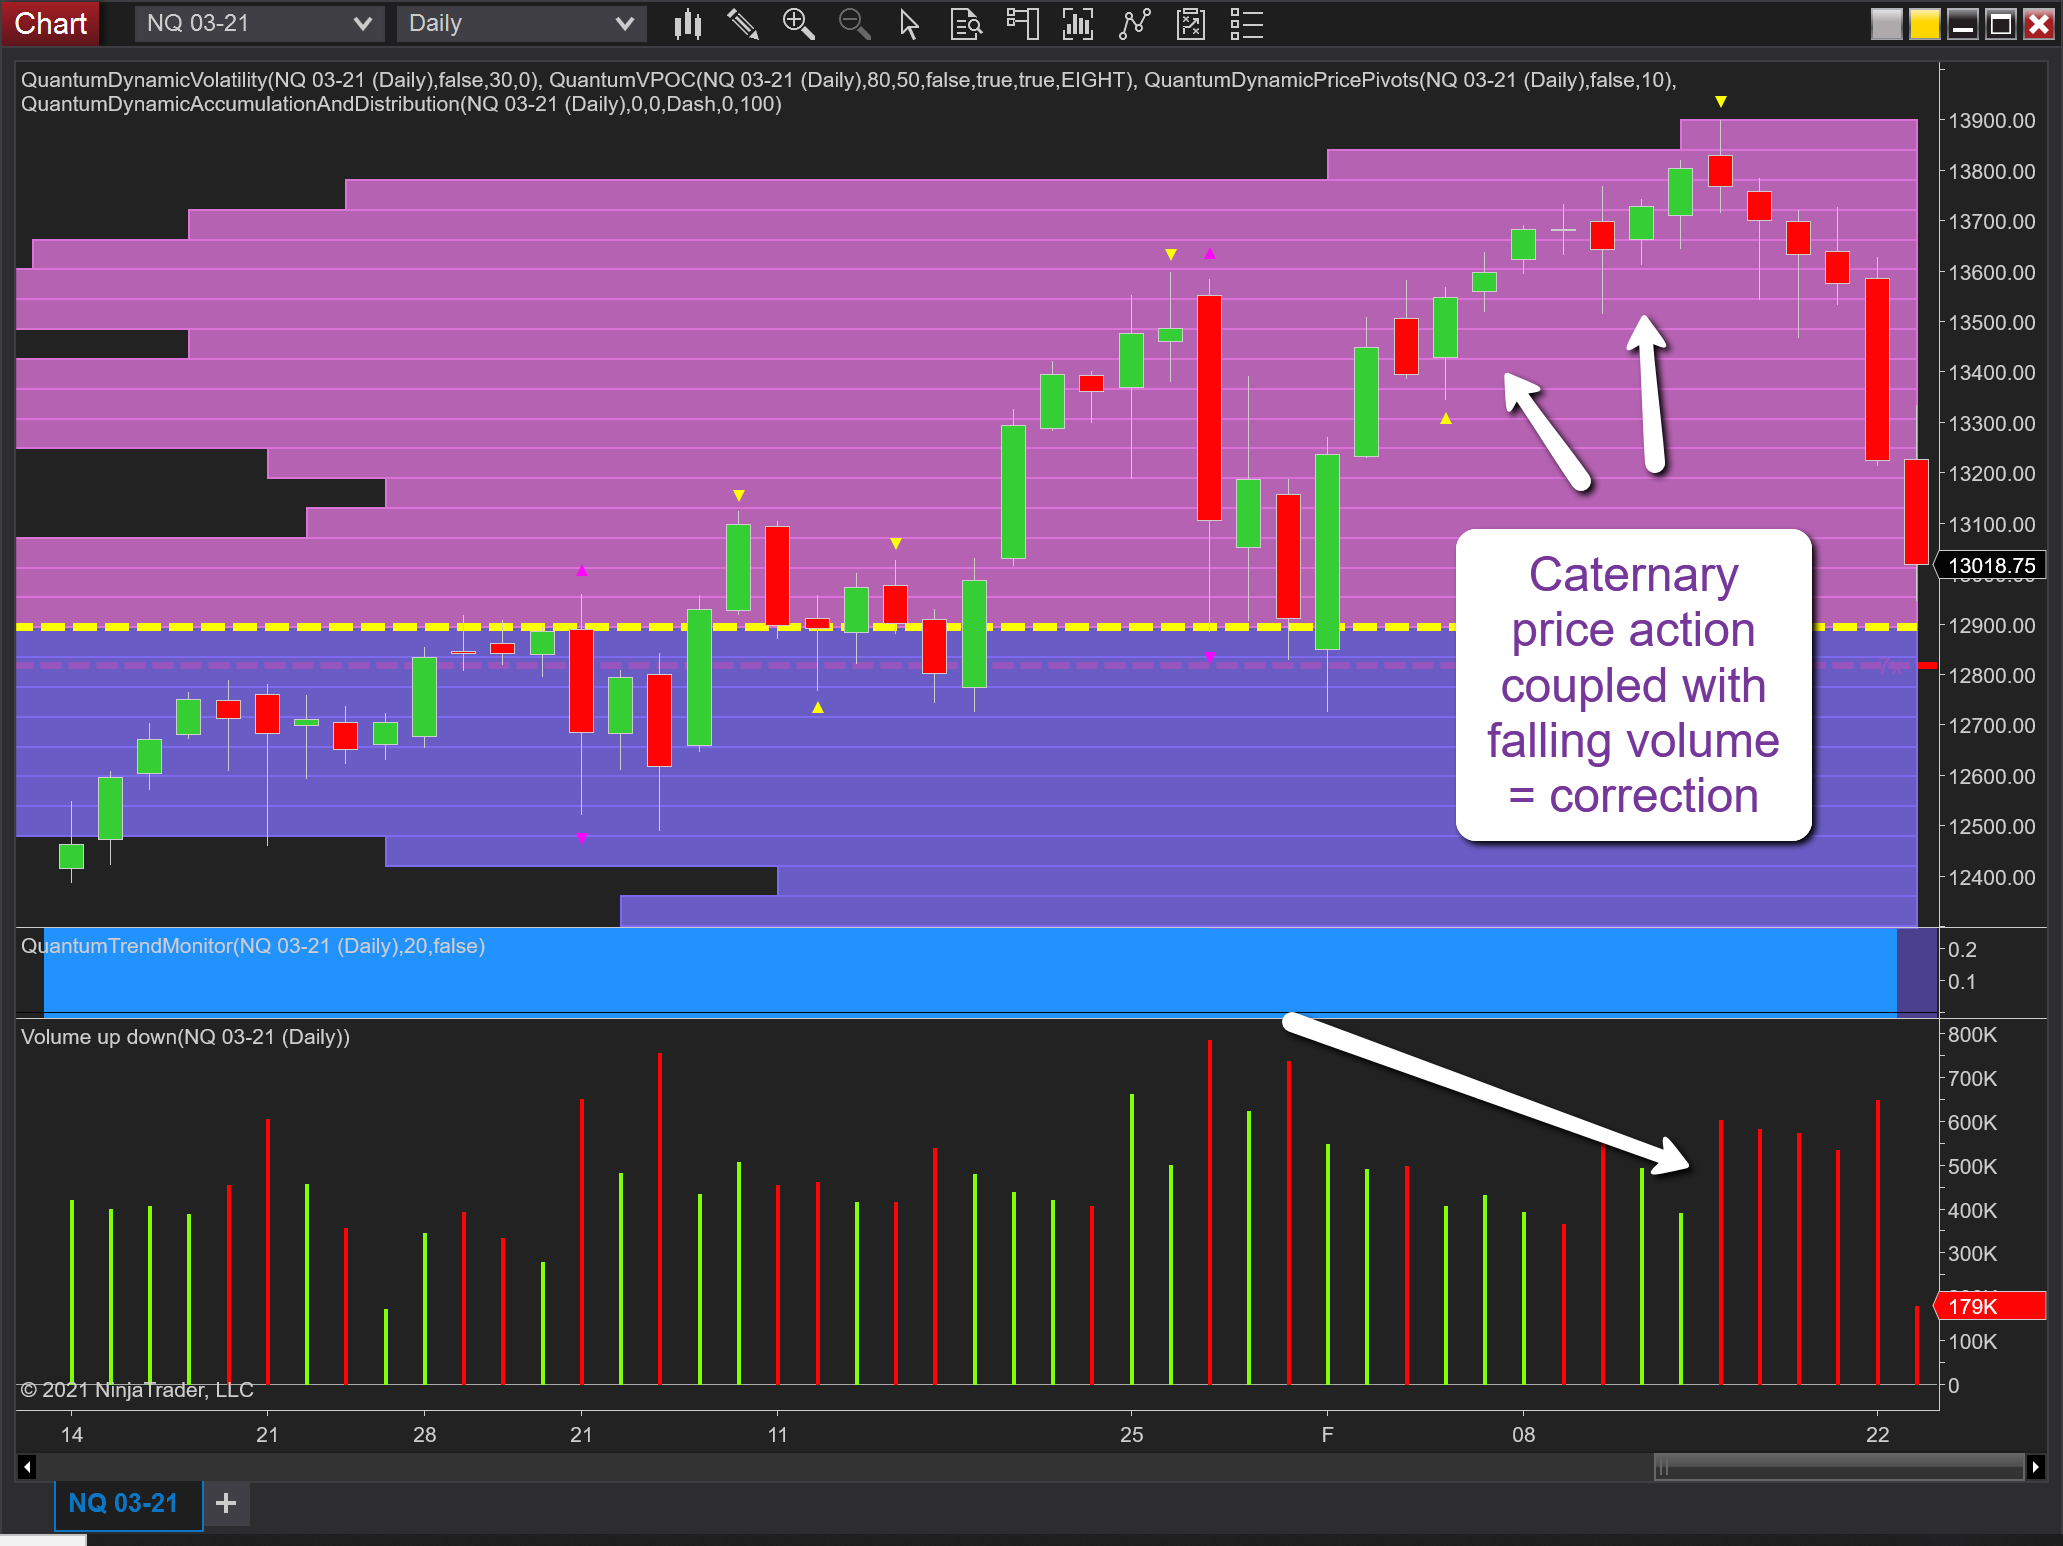
 Nasdaq 100 Daily Chart.
I outlined a week or so ago that U.S. equities were looking particularly fragile. And while I do not believe we are witnessing a major reversal, what has occurred in the last few days was expected. The reason I was confident in suggesting this was due to two factors. First, the shape of the price action. And second, the associated volume.
As an example, I am taking the price action for the March contract for the Nasdaq 100. First, since the start of the month, the progress higher for the index has been laboured with spreads generally narrowing and so creating what I call a catenary price curve, where the price is rising, but at a slower pace, each day on ever-decreasing spreads. Moreover, we have seen similar price action on the S&P 500 Futures, although so far the Dow Jones Futures has not followed suit as value stocks are once again in favour and have been supportive of the index.
So this is the reason, from a price perspective, but what about volume?
Here, the message is also clear with the decline in daily volume since late January, with each green up candle associated with lower volume. Combine these two factors together and there can only be one conclusion, which is what we are now seeing. In other words, a correction and reversal to the volume point of control anchored in the 12,900 area as denoted with the yellow dashed line. Once this is reached expect to see the NQ Emini bottom out and move into a congestion phase, particularly as we have a well-defined level of support immediately below, at 12,800 as denoted with the red dashed line of the accumulation and distribution indicator which is likely to act as a strong platform as it did on January.
Finally, this week’s two-day testimony to Congress by Fed Chairman Jay Powell comes against the backdrop of rising bond yields and inflation, which are the biggest enemies of growth stocks.
Leave a comment