It will be another holiday-shortened trading week, with the stock market closed on Friday, January 1. There will also be limited amounts of economic data this week, which means there won’t be much news to push the markets around unless something new with the stimulus bill develops. I find it unlikely that a new bill is presented or that President Trump will sign the current bill. He will most likely pocket veto the bill, making it essentially disappear.
S&P 500
 SPY Index
Resistance for the S&P 500 is currently around 3,715 with support around 3,700 then 3,655. I continue to think that we will head lower over the next several weeks, filling plenty of gaps on the way towards 3,200.
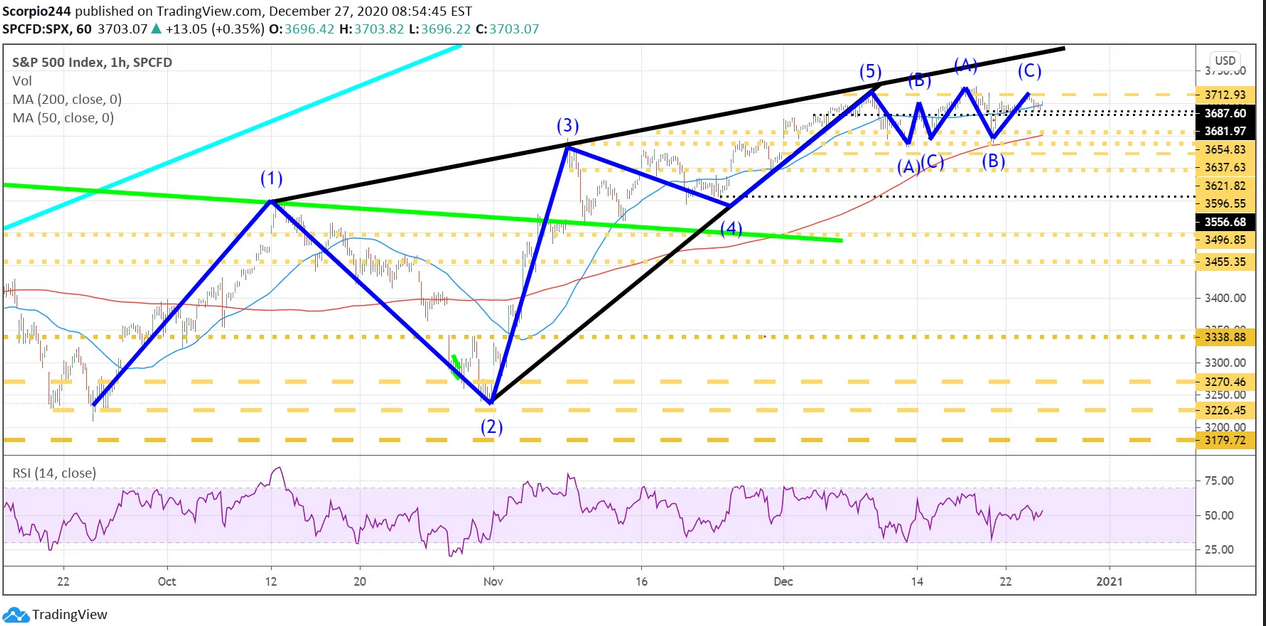 S&P 500 Index – 1 Hr Chart
NASDAQ
It is not all that much different this week for the Qs, with resistance now at $310.50 and support around $308.
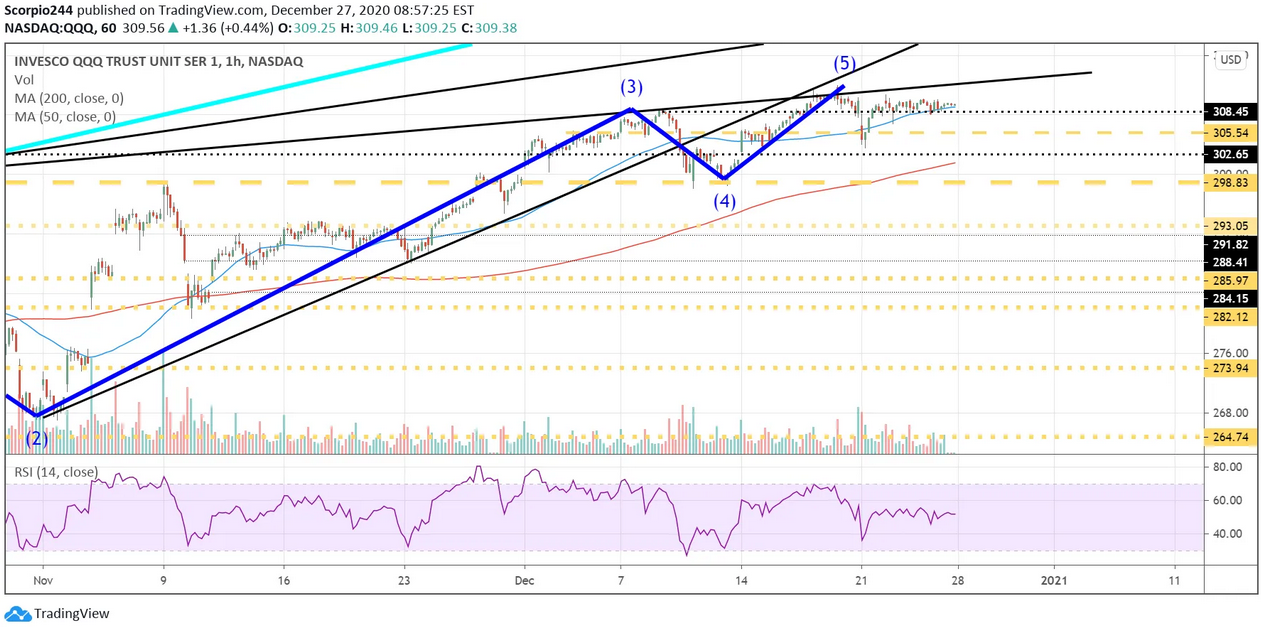 QQQ 1-Hr Chart
Gamestop
Gamestop is a stock that we started to look at last week. Based on my analysis, this seemed like a typical convexity squeeze, and now it is breaking down. There is a descending triangle pattern that is forming, and the RSI and volume levels are falling. It would indicate the stock’s next level of support comes around $18.65.
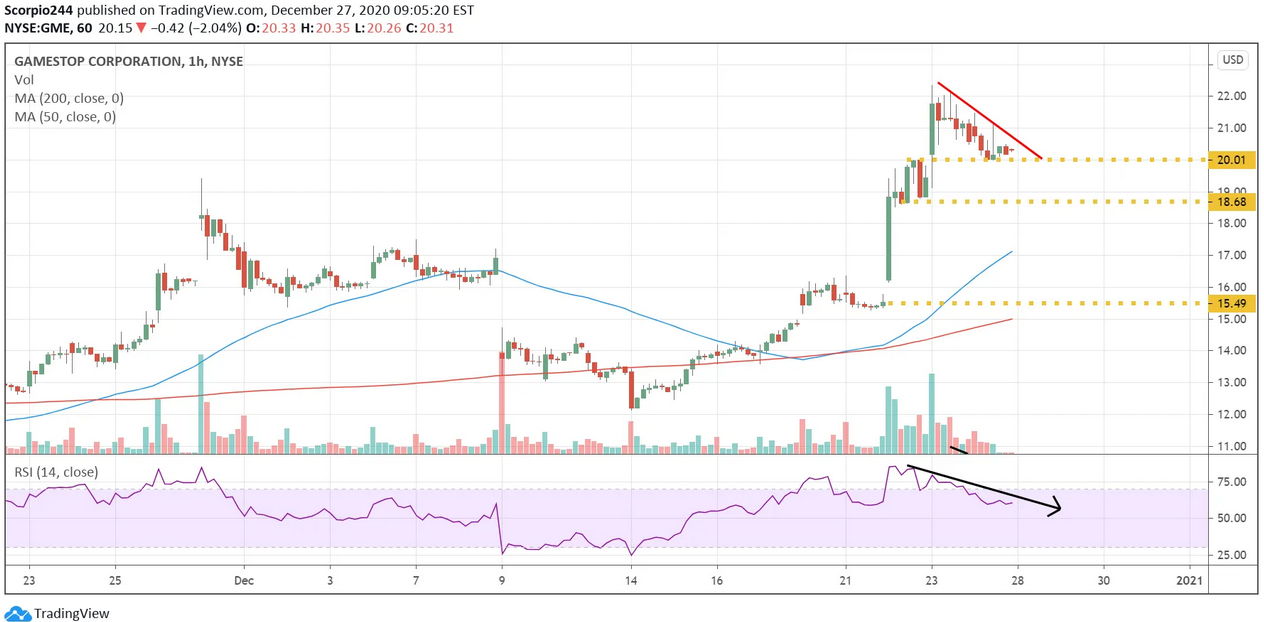 Gamestop Corporation 1-Hr Chart
Zoom
Zoom may not be finished falling over the short-term, with the stock moving to support at around $370. A break of support would indicate a sharp decline is to come, with the shares dropping to around $325.
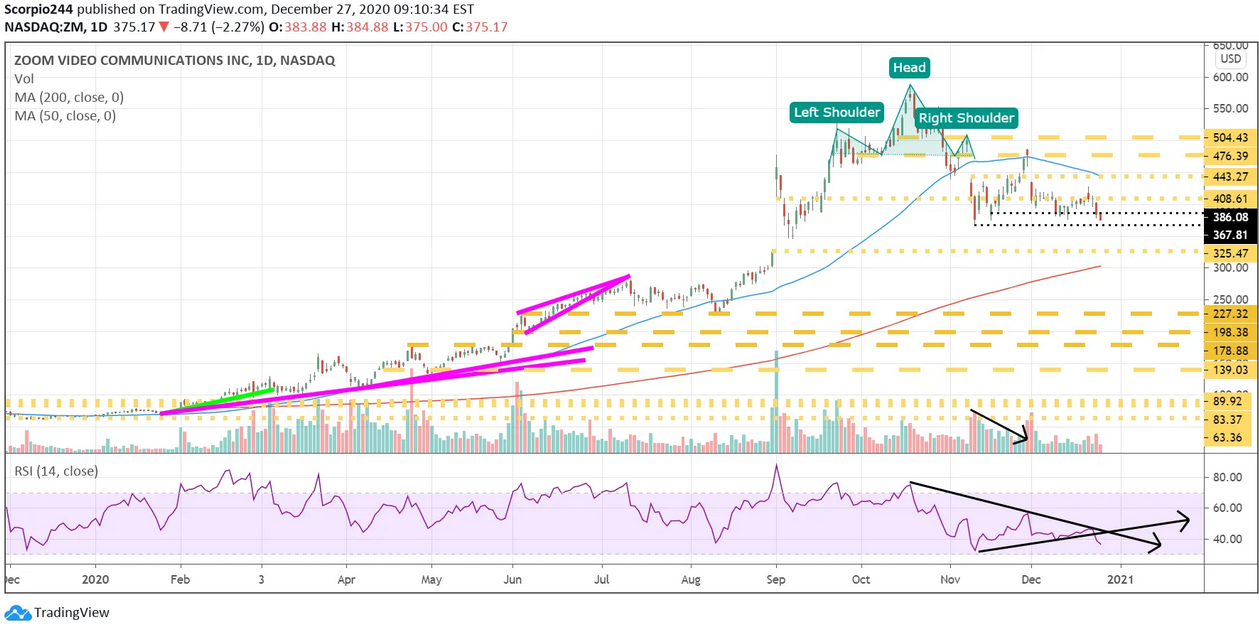 Zoom Video Communication Daily Chart
Micron
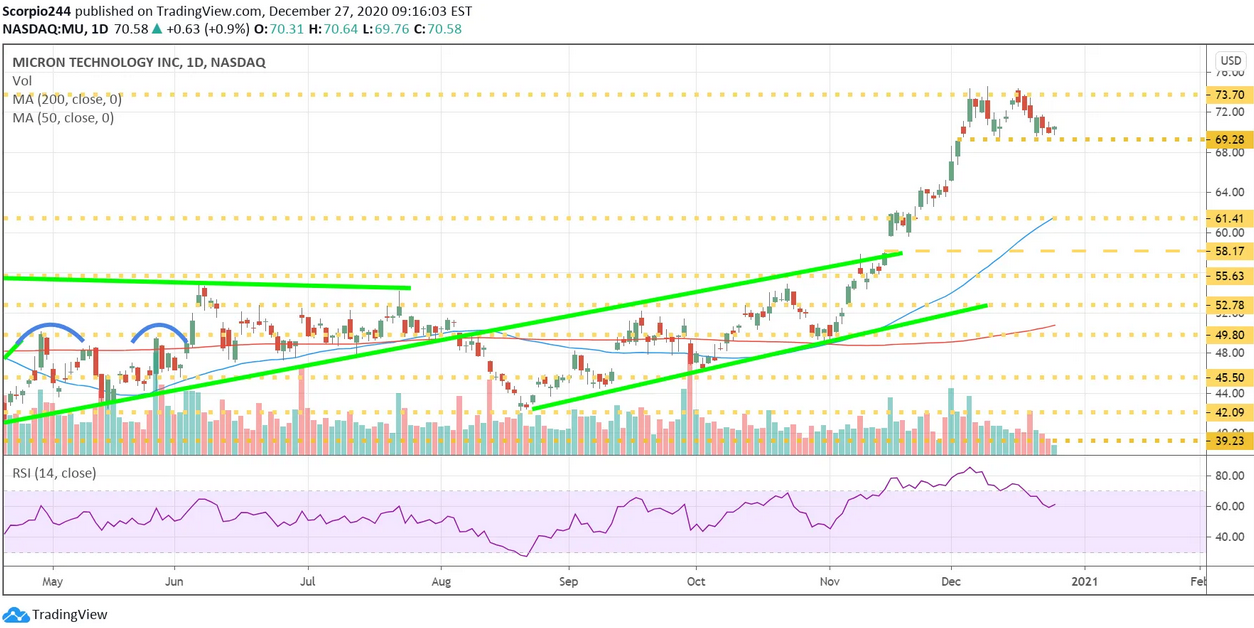
Micron (NASDAQ:MU) stalled at resistance around $70 and now faces a reversal of fortune. The stock is sitting on support around $69 with the potential for it to drop to around $61.40 over the next 2-week ahead of results.
 Micron Inc Daily Chart
FuboTV
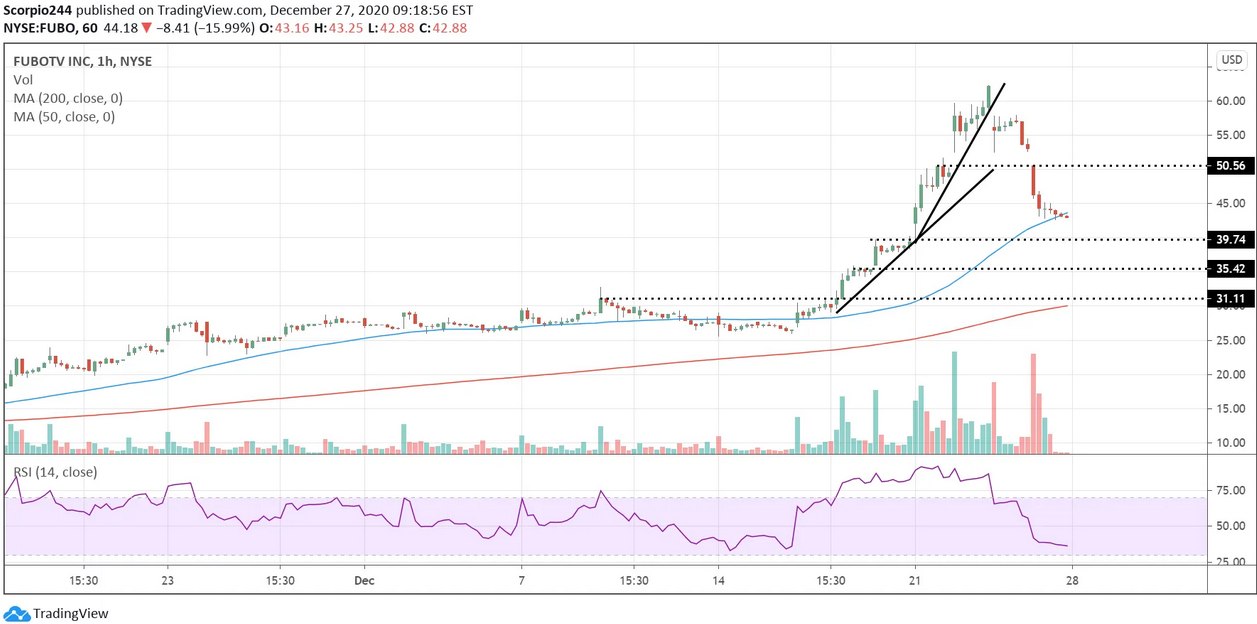
Fubo hasn’t finished falling yet, as the convexity squeeze has popped, and the stock still faces a lock-up expiration this week. It could have more downside to around $39.75.
 FuboTV Inc 1-Hr Chart
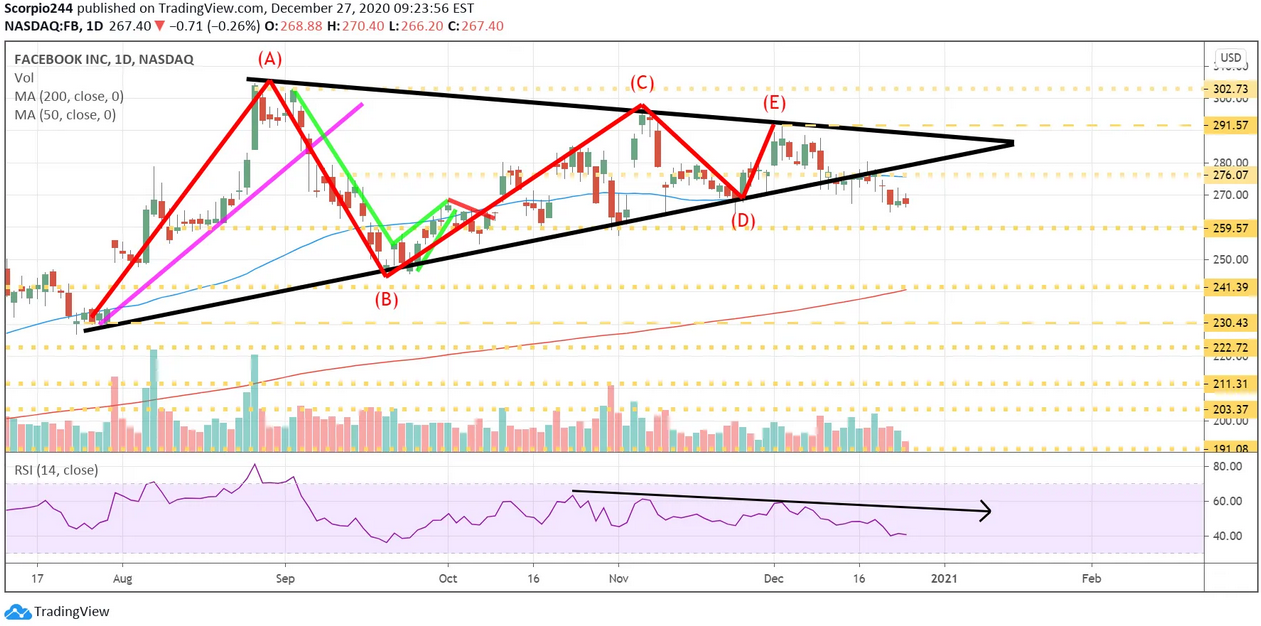
Facebook (NASDAQ:FB) broke down this past week, and I continue to think the stock is heading lower towards support at $259.50. The stock has fallen through the bottom uptrend after completing the “ABCDE” triangle pattern.
 Facebook Daily Chart
Apple
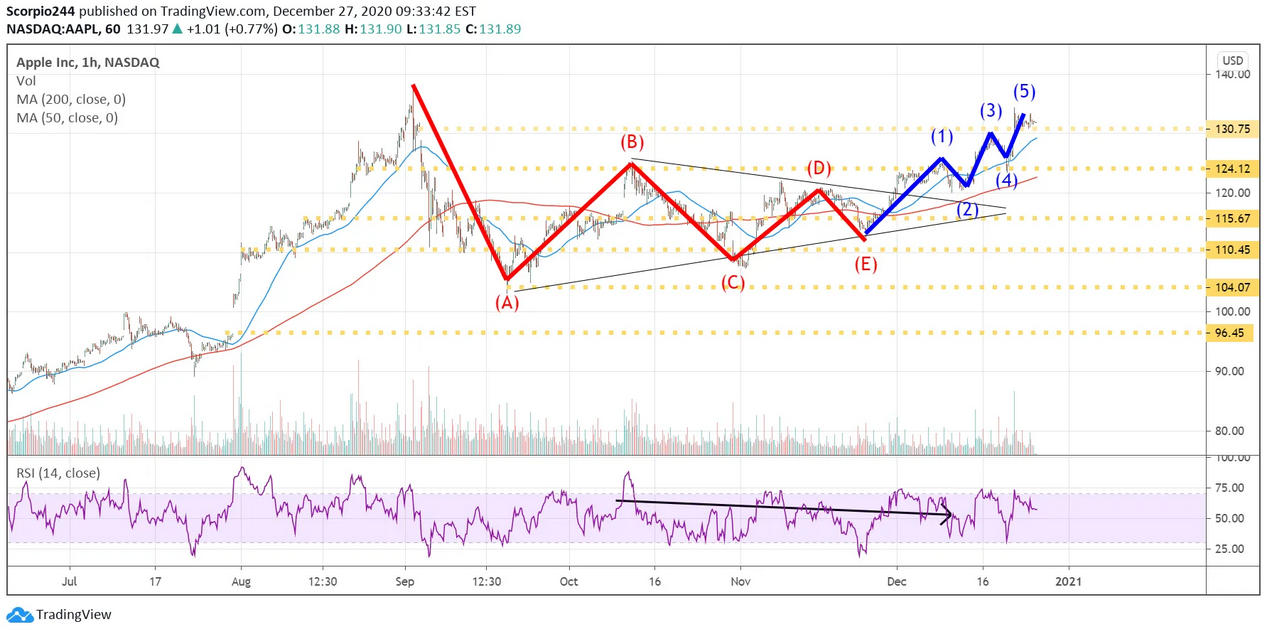
Apple (NASDAQ:AAPL) completed a gap fill at $131 while completing a 5-count impulse wave higher. It should now result in a reversal lower, back to $124 this week.
 Apple Inc 1-Hr Chart
