It will be a big week with the Fed on deck afternoon. It’s the quarterly meeting, which means there will be an along with the dot plots.
Given the slowdown in the economy, it seems highly plausible that the Fed will downgrade the 2021 GDP growth forecast. However, that is unlikely to deter the Fed from tapering its asset purchase. I expect that the Fed will have strong language in the to indicate that tapering will begin at the November meeting.
1. S&P 500
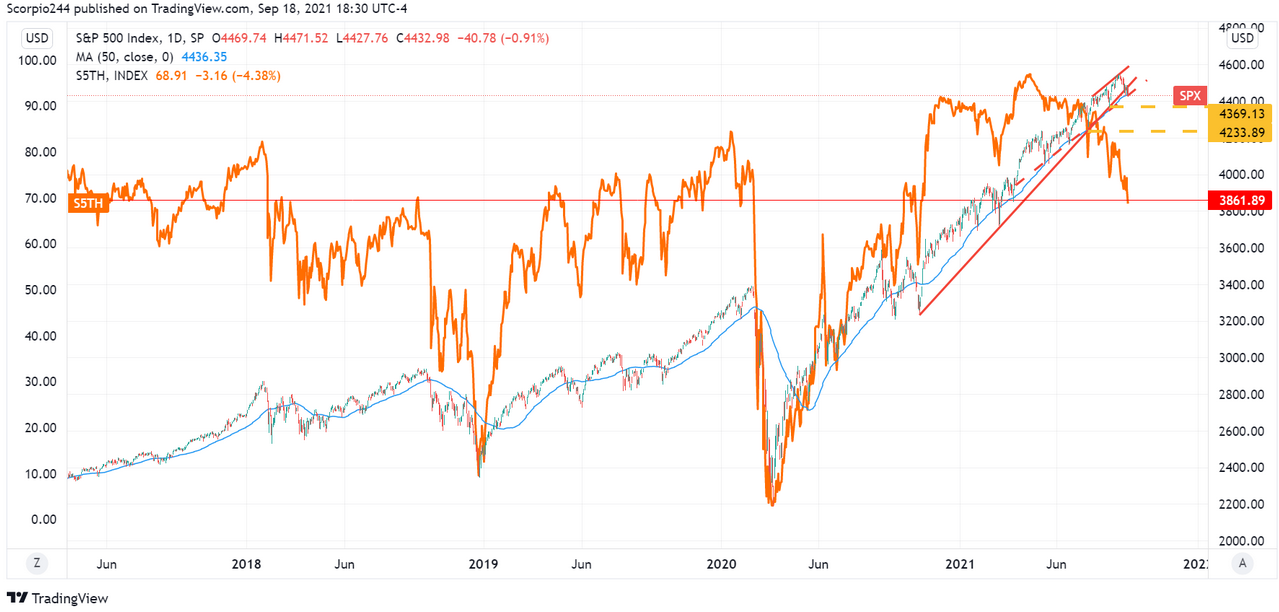
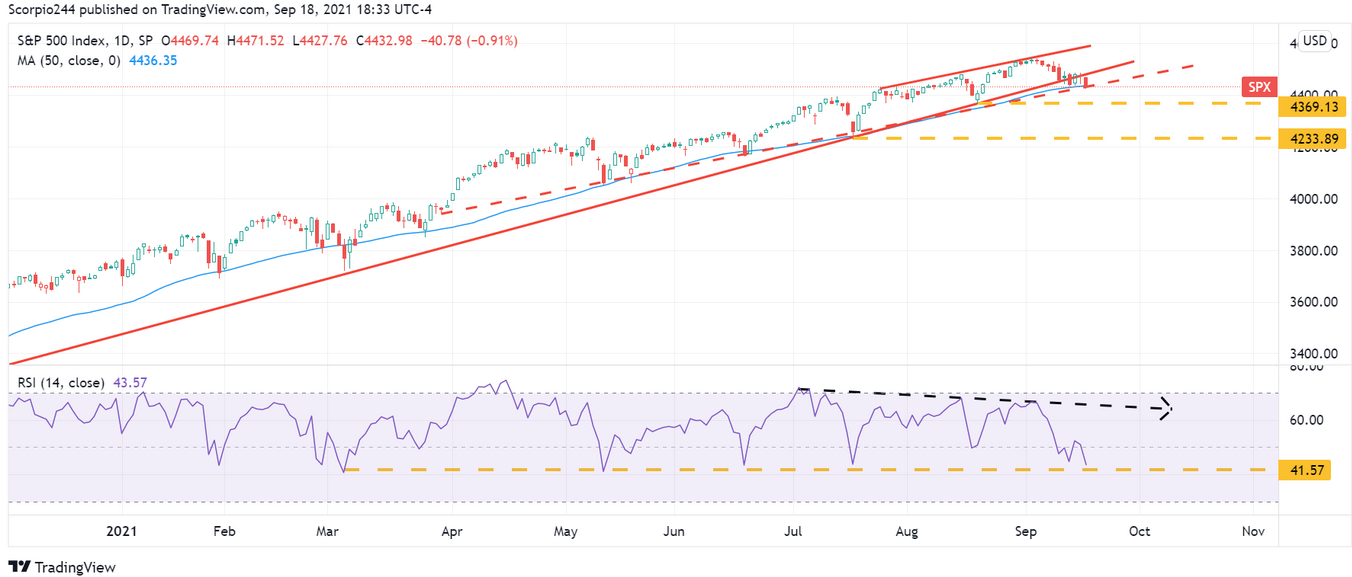
The fell last week ahead of the meeting and found itself in an unfavorable position as it once again was testing its 50-day moving average. However, as I reviewed in last week’s free YouTube video, the market’s breadth was not nearly as strong as in periods past. The most obvious was the deterioration in the percentage of stocks above their 200-day moving average.
Additionally, the RSI was trending lower and testing the lower bound of support around 42. The RSI made a series of lower highs even though the S&P 500 made a higher high; this was a clear bearish divergence. Meanwhile, the index also broke a significant uptrend which started in October of 2020, with the potential to test support around 4365 and perhaps 4235.
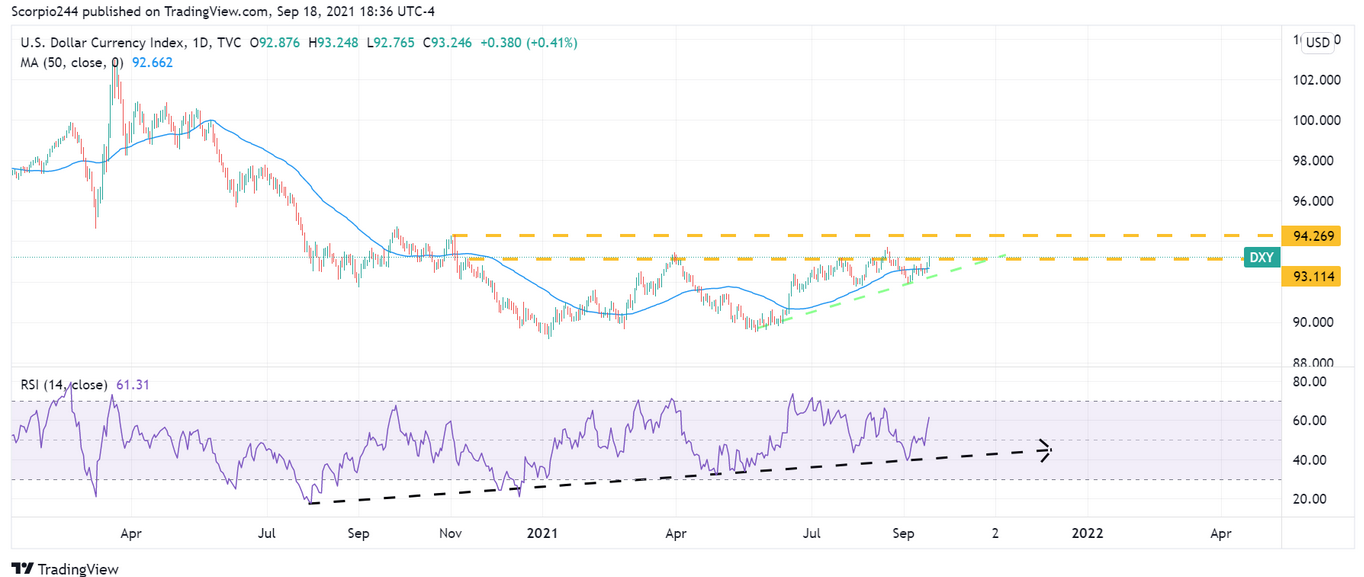
Several factors from a fundamental standpoint suggest earnings growth rates may decelerate faster, as earnings estimates themselves turn lower. All of this is likely to weigh on the index when the Fed begins reducing the pace of its asset purchases, which will help the break out. It is one way the Fed can fight rising inflation rates and help to bring commodity prices down by jawboning the dollar higher. However, this puts substantial pressure on the international markets, specifically emerging markets.
2. South Korea
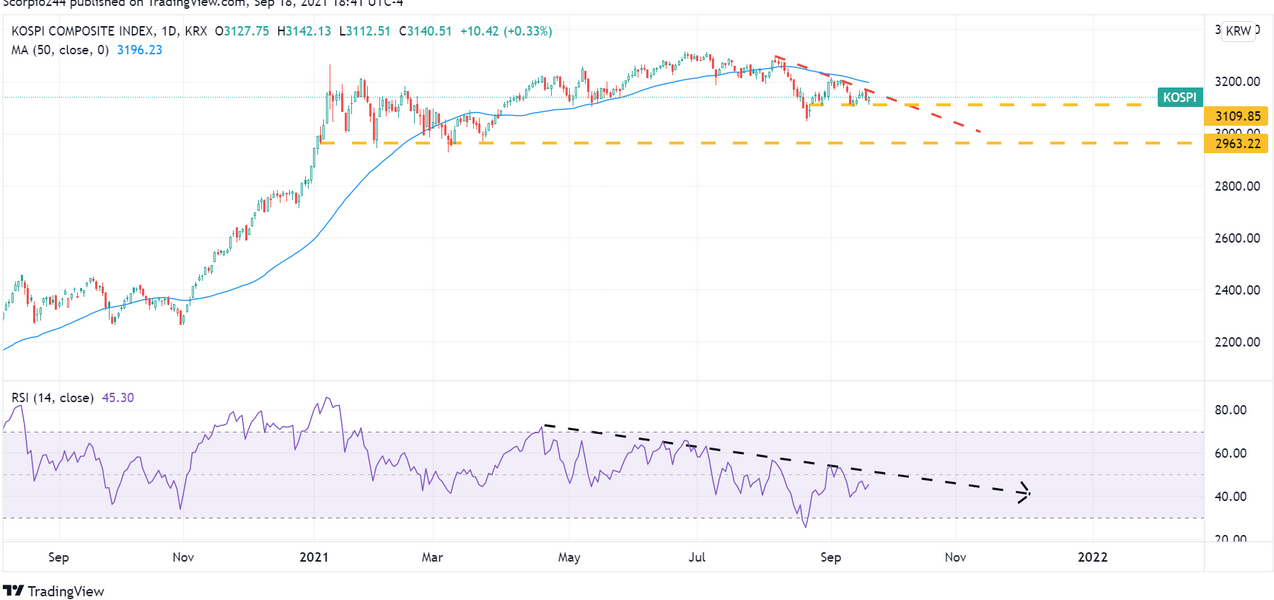
South Korea (NYSE:) has been one market showing signs of struggle with the index down by more than 6% off its highs. The RSI suggested that the continued to trend lower, potentially as low as 2,963.
3. AUD/JPY
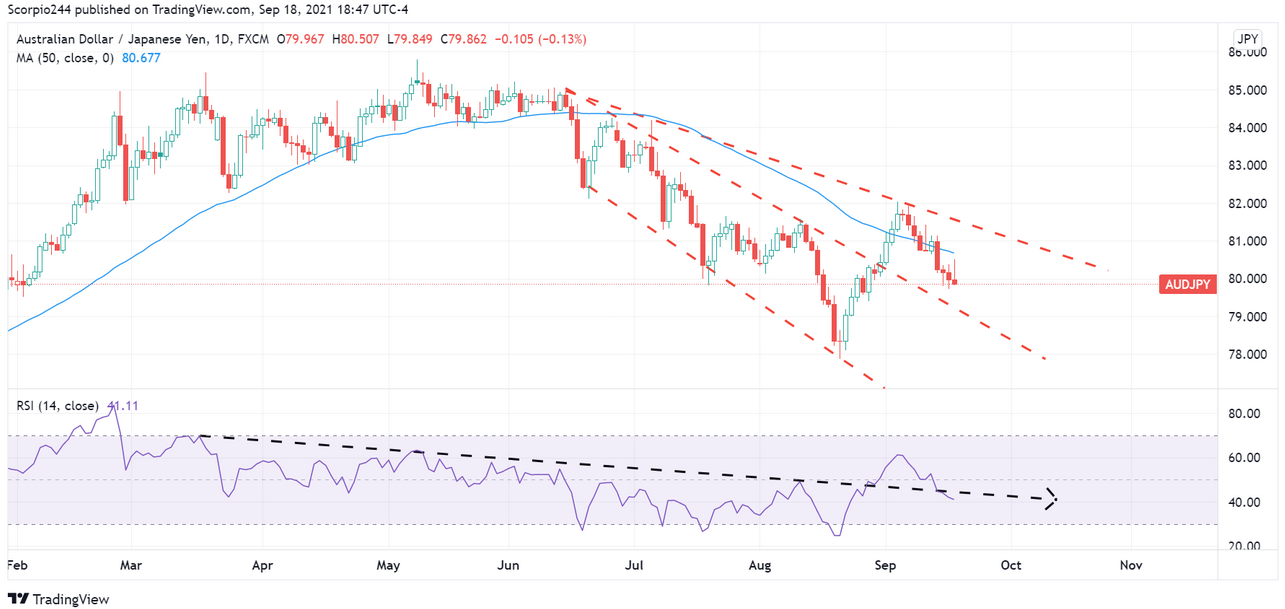
A key risk gauge is the pair, trading decidedly lower in recent weeks. After attempting to turn higher, the downtrend has resumed. If this worsens, it will be a clear signal of risk-off, if not already.
4. Copper
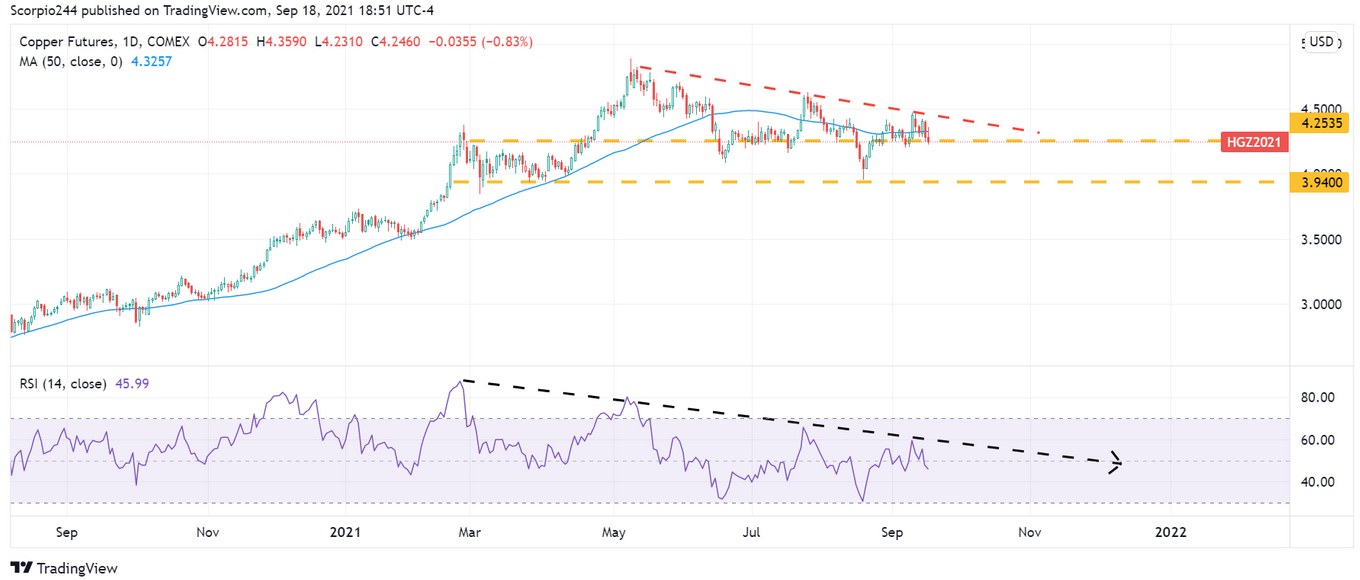
prices are another risk-on/off signal and will struggle under the weight of a rising dollar. The RSI was trending lower, suggesting the drop in the metal is not over. Additionally, the descending triangle was a bearish technical pattern, with the next level of support somewhere around $3.95.
5. Freeport
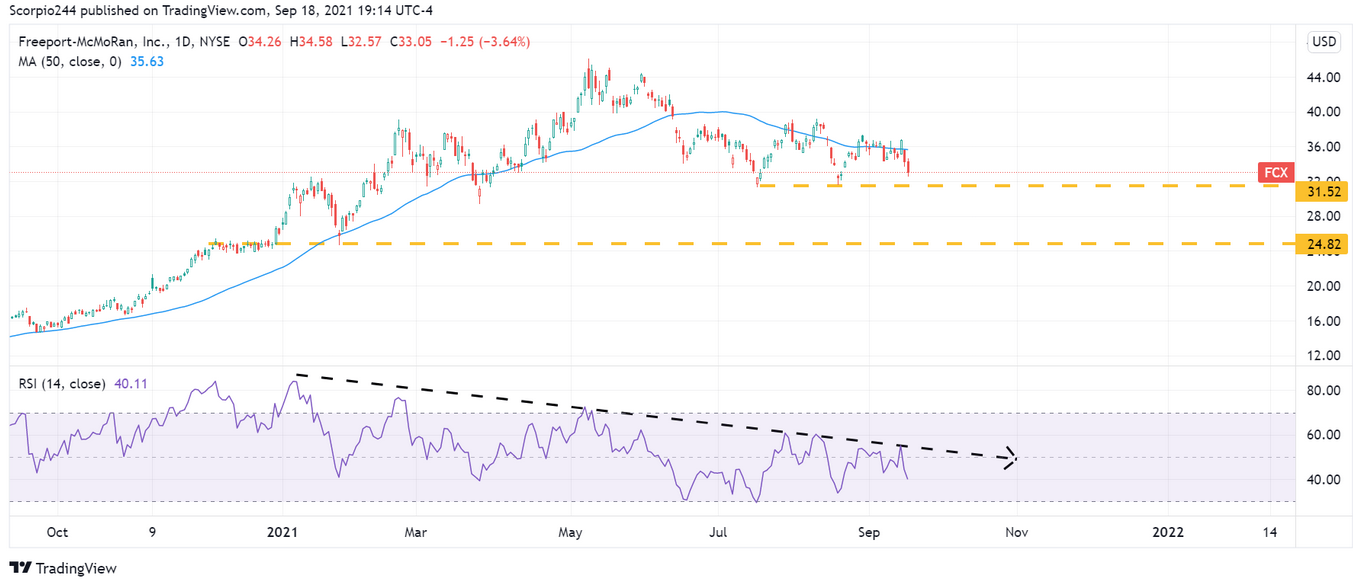
If copper was going to head lower, then Freeport-McMoran Copper & Gold (NYSE:) will not be spared in the process. There was a massive level of support at $31.50, and once broken will help to push the shares lower to $24.80. The RSI was sending a clear message that the trend in this stock remained lower.
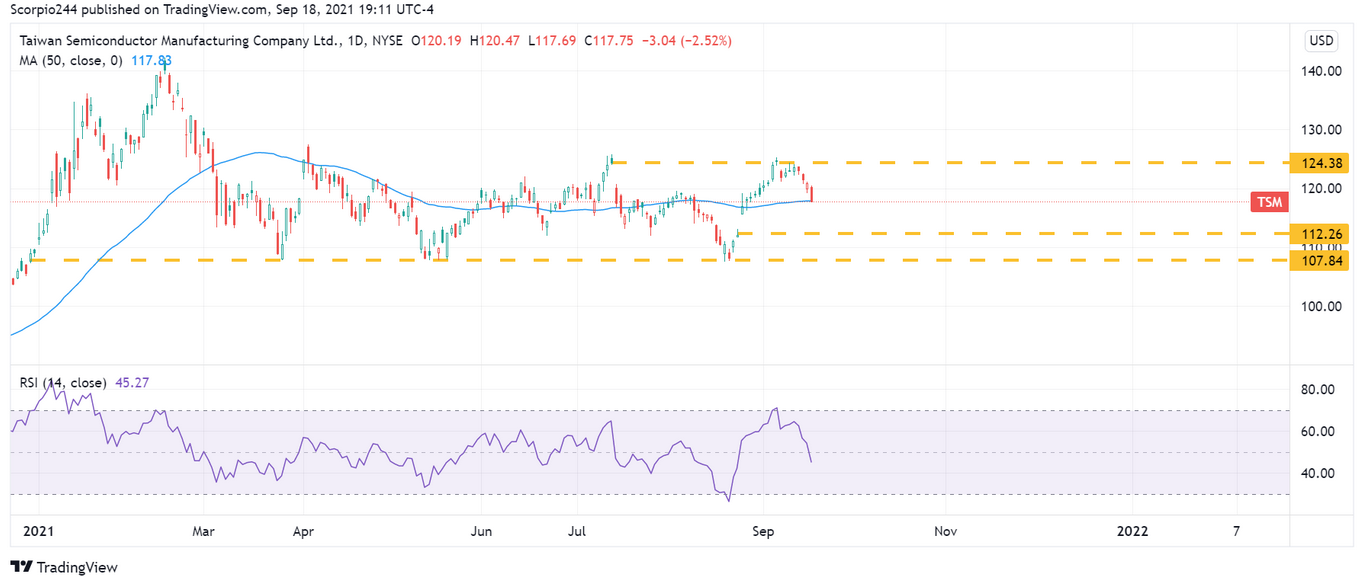
6. Taiwan Semi
Taiwan Semiconductor Manufacturing (NYSE:) was one stock that was likely to struggle if the dollar pushed higher, with a big gap that needed to be filled around $112.
7. Apple
The uptrend in Apple (NASDAQ:) was broken on both the price and the RSI. That will set up a drop to around $135.

8. Facebook
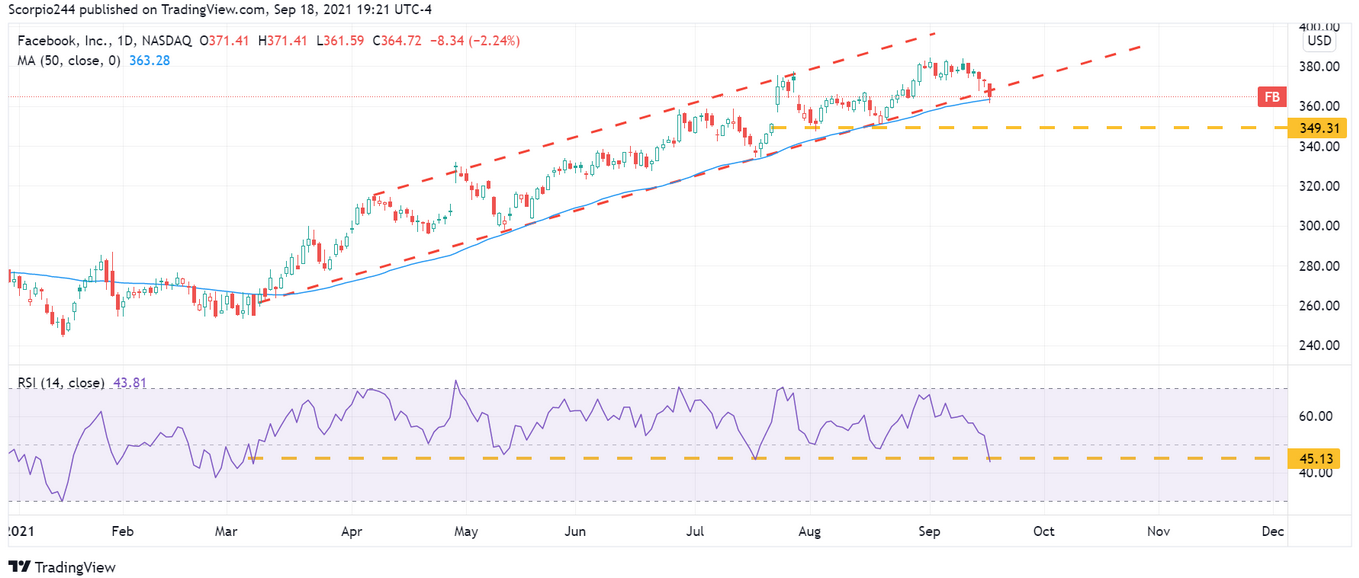
Facebook (NASDAQ:) broke its uptrend, which also formed at the end of March, similar to the one seen on the S&P 500. However, Facebook created a new low on the RSI and broke the uptrend on the price as of Friday’s close. It may be foreshadowing what happens next with the S&P 500.
