Information technology infrastructure company SolarWinds Corporation (NYSE: SWI) stock has been punished heavily from security and breaches on its Orion platform linked to Russian hacker groups. Shares have collapsed more than (-30%) since the first report on Dec. 13, 2020. Shares are down (-15%) mirroring the inverse performance of the benchmark SPDR S&P 500 (NYSE:SPY). The SUPERNOVA malware has jeopardized a network of U.S. federal agencies and major corporations. Further negative publicity by president-elect Joe Biden managed to snuff out recovery attempts in the shares. On the flipside, cybersecurity stocks including Crowdstrike (NASDAQ:), Palo Alto Networks (NYSE: NYSE:PANW) and FireEye (NASDAQ:FEYE) have seen shares surge to annual highs. The question will be how the data breach will affect SolarWinds’ current and new clients or impact its 7.7% annual growth rate. The Company also had originally planned to spin-off its MSP business but even that may be in jeopardy. However, the panic in the shares are overextended enough to provide opportunistic price levels for risk-tolerant investors to scale in bargain level positions.
Q3 2020 Earnings Release
On Oct. 27, 2020, SolarWinds releases its third-quarter earnings report for the quarter ending in September 2020. The Company saw earnings-per-share (EPS) of $0.28, excluding non-recurring items, versus consensus analyst estimates of $0.24, beating by $0.04. Revenues rose 7.7% year-over-year (YoY) to $261.28 million beating analyst estimates for $256.6 million. The Company provided flat Q4 EPS guidance of $0.25 matching consensus estimates of $0.25. Non-GAAP Q4 revenues are expected in the range of $261 million to $266 million versus consensus analyst estimates for $262.18 million. The transition to a subscription-based model is showing better than expected improvement.
Overreaction?
It’s safe to say SolarWinds is definitely experiencing extreme negative sentiment. The Cybersecurity and Infrastructure Security Agency (CISA) posted on its website that the SolarWinds cyberattack is still impacting federal, state and local governments and other private sector organizations. The agency suggests disconnecting affected devices. Shares are trading at a forward P/E of 16 versus an industry average around 27 P/E. SolarWinds provides over 50 IT administration tools under a single unified platform which is Orion. The advantage for SolarWinds is the one-stop-shop convenience rather than customers piecing together the services through different vendors. As bad as the hack has been publicized, the reality is that not all clients have been breached (25+ out of 19,000) and the media tends to overdramatize the effects. For most clients, the aggravation of moving off the Orion platform and replacing the admin services ala carte with separate tech support and service contracts is not worth it, especially with the security patches and updates currently being deployed.
Software Fixes and Brand Rebuilding
SolarWinds has rolled out more fixes for all Orion products targeting the SUPERNOVA malware for all supported and unsupported versions of these products. The latest fix on Dec. 24, 2021 was the third update to the previous two hot fixes released on Dec. 14 and Dec. 15, 2021 aimed at preventing the exploitation of a vulnerability on the Orion platform. The Company has been active in communication updates and free consultations to enable customers to secure their environments. Shares should stabilize with continued updates. Prudent investors looking to scale into exposure at opportunistic pullback levels should be aware of bottoming attempt forming.
 SolarWinds Corp Weekly Stock Chart
SWI Opportunistic Pullback Levels
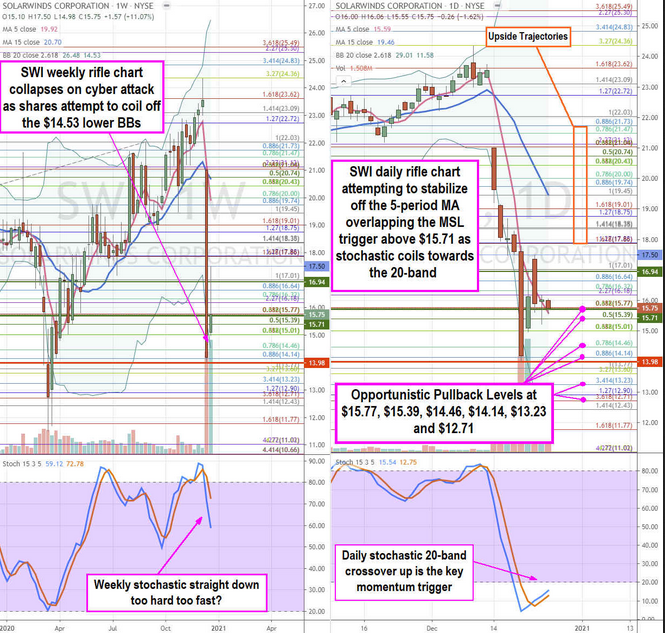
Using the rifle charts on the weekly and daily time frames enables a more precise near-term view of the price action playing field for SWI stock. The weekly rifle chart illustrates the extreme sell-off from the $24.36 Fibonacci (fib) levelthrough the weekly lower Bollinger Bands (BBs) at $14.53. The weekly stochastic is falling under the 60-band. The daily rifle chart completed a full stochastic oscillation down to the 5-band and attempting to coil towards the 20-band with a mini pup if the daily market structure low (MSL) can trigger above $15.71, which overlaps with the 5-period moving average (MA). A second higher MSL triggers above $16.94. Prudent investors can monitor opportunistic pullback levels at the $15.77 fib, $15.39 fib, $14.46 weekly lower BBs/fib, $14.14 fib, $13.23 fib, and the $12.71 fib to scale into a position. The upside trajectories range from the $17.88 fib up to the $21.73.
Leave a comment