With a P/E ratio of 840, I think we can all agree that Peloton (NASDAQ:PTON) is a richly-valued creature. The market seems to have embraced the thought that:
- The lockdown will last forever;
- In spite of being famously pudgy and lazy for decades, Americans will all suddenly want to exercise vigorously at home;
- They will do so by way of a very expensive stationary bike with a big monthly recurring fee.
Of course!
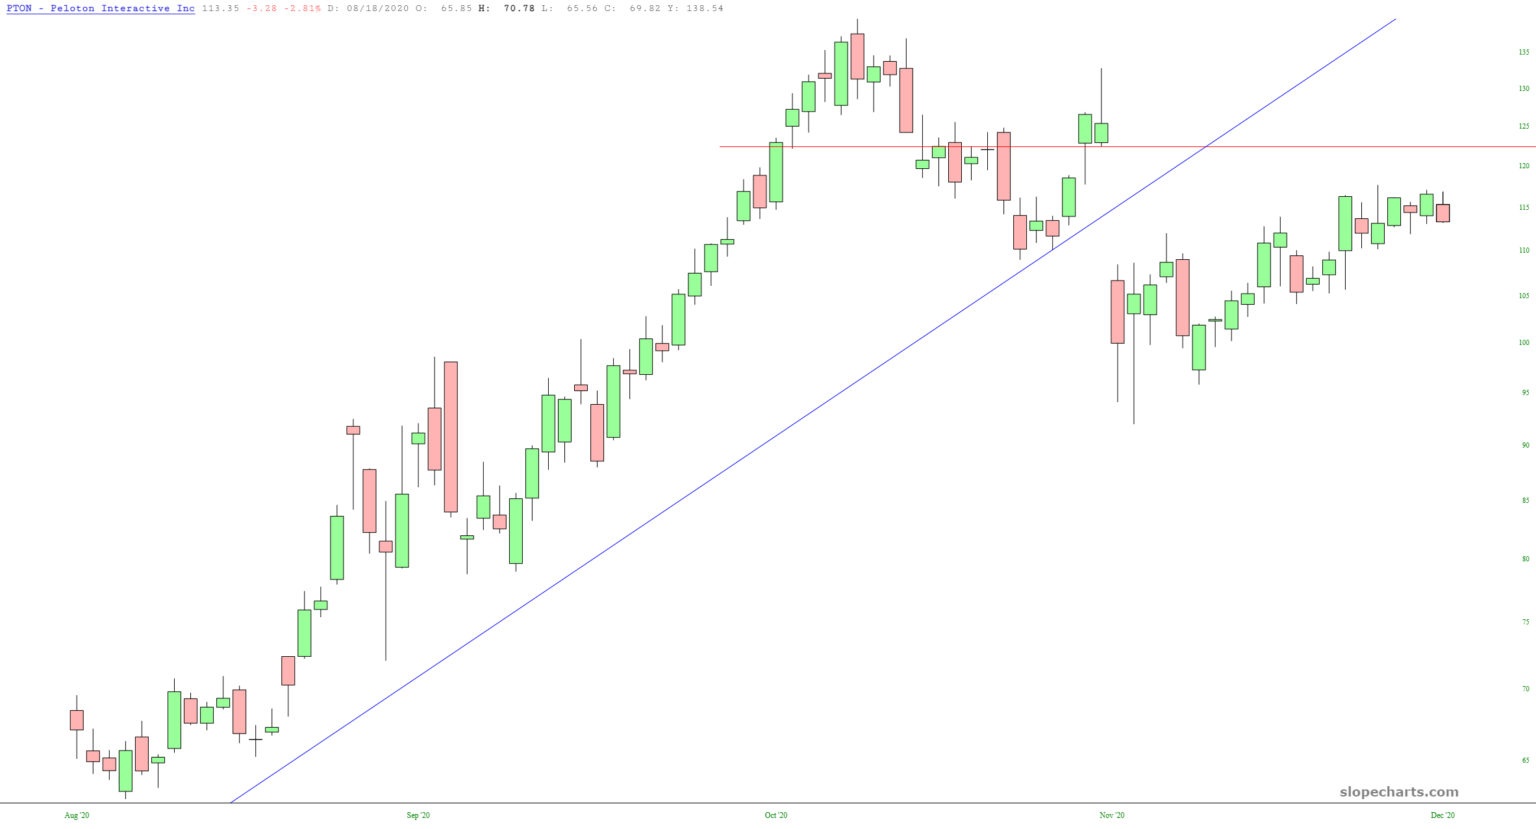
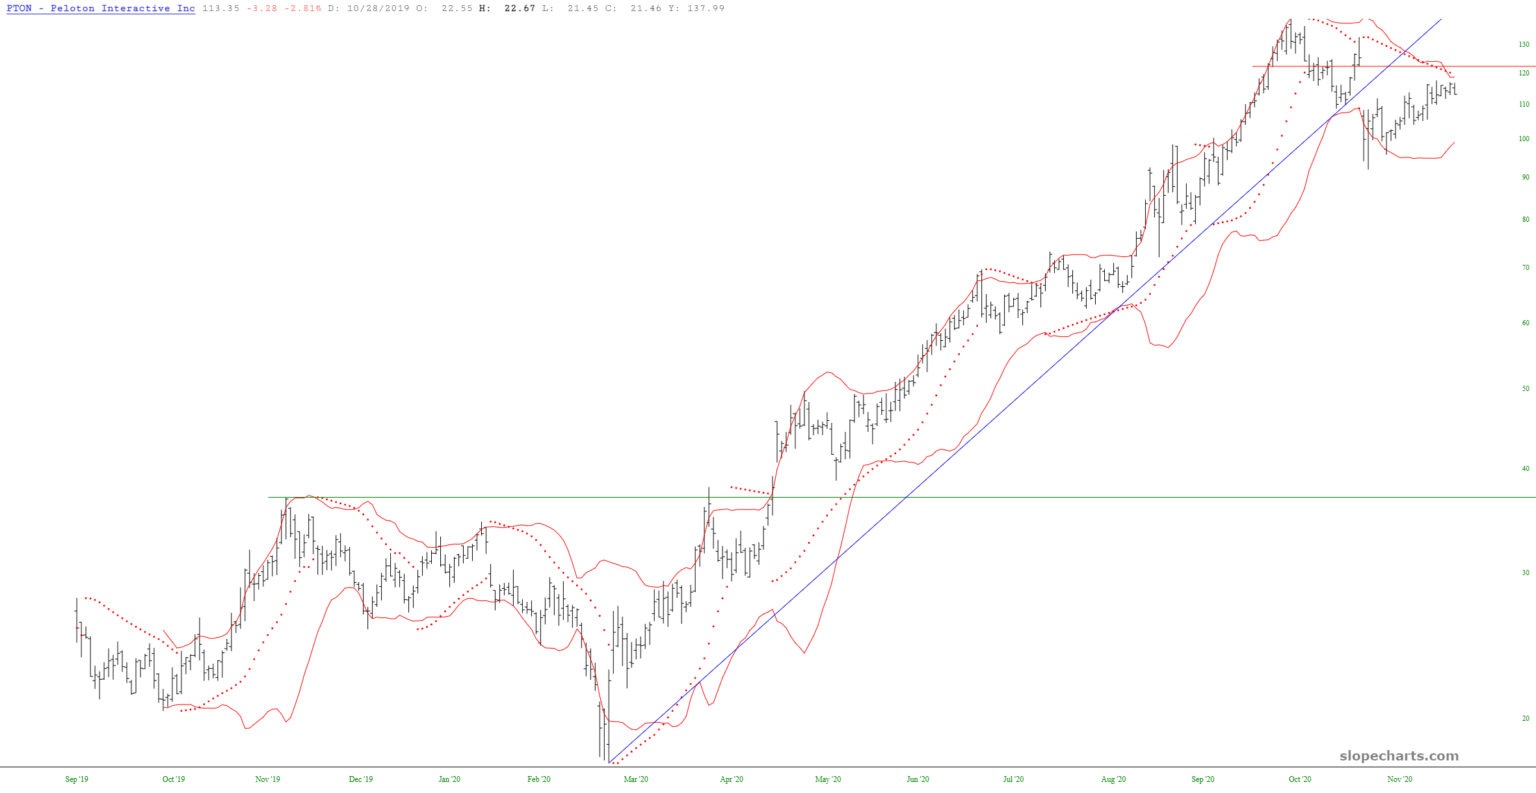
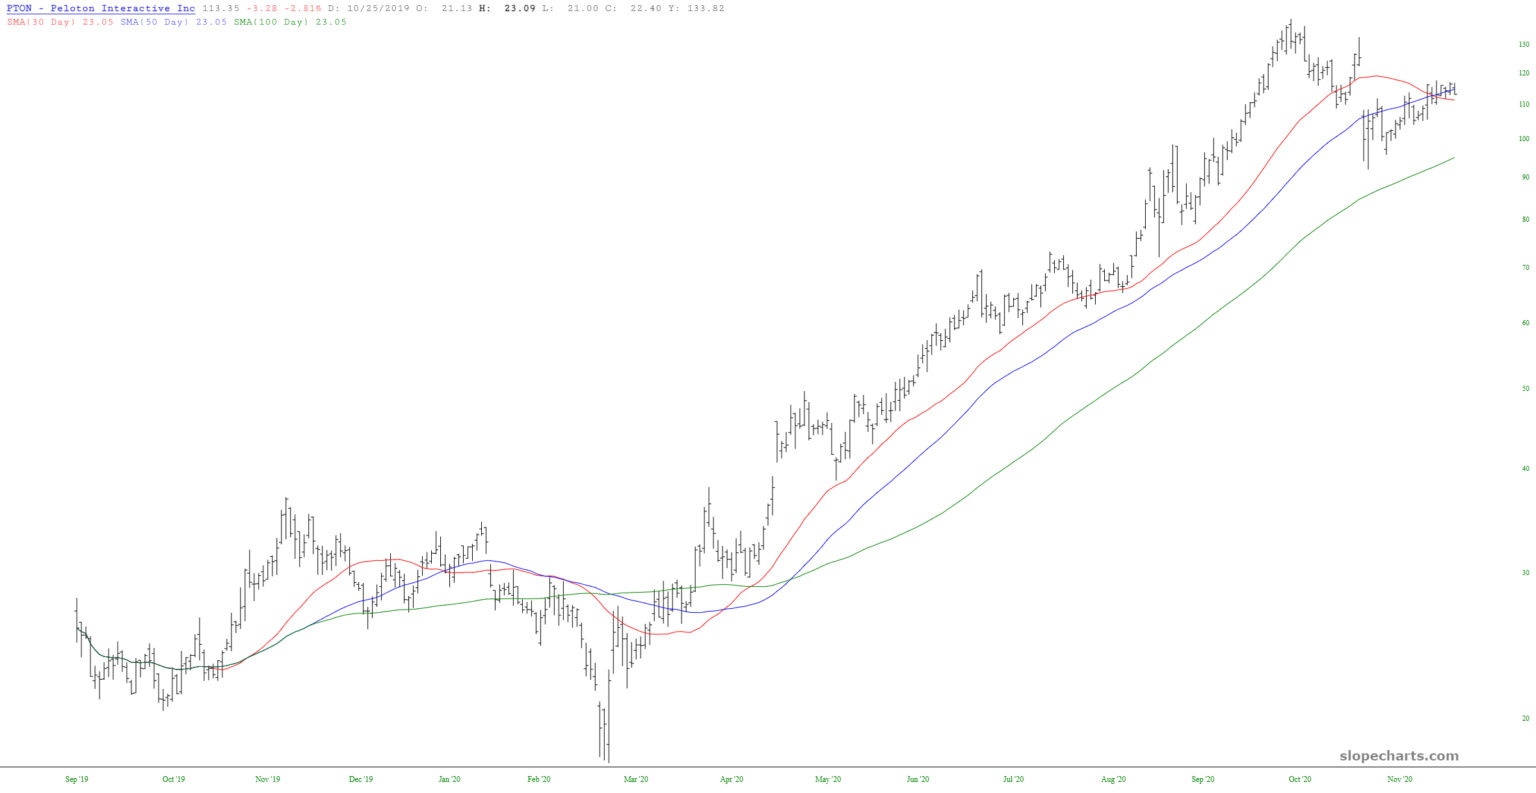
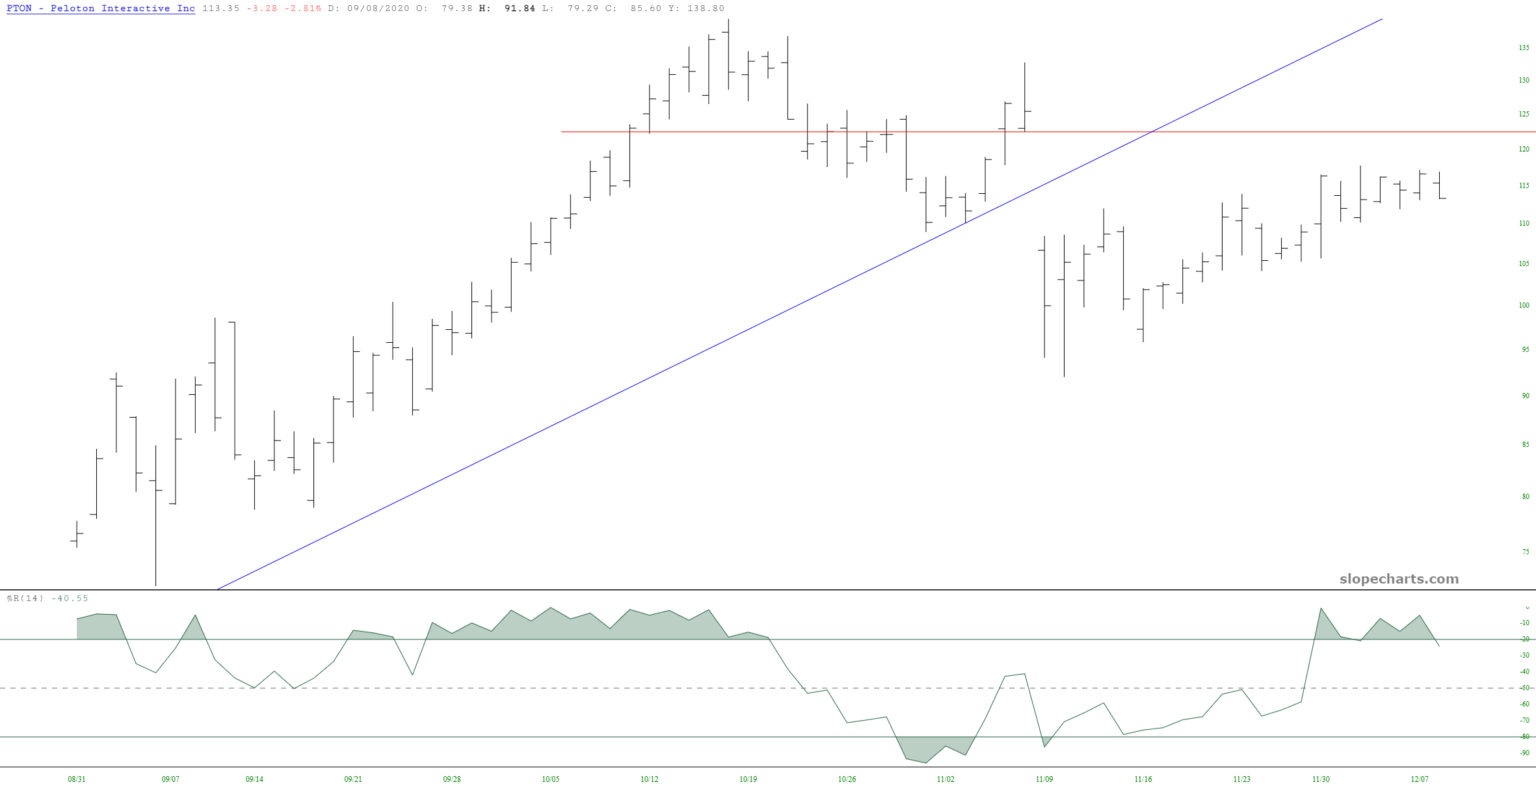
I’d like to suggest these charts, and the accompanying indicators, indicate otherwise:
The price gap:
 Peloton Candlestick Chart.
The bearish PSAR and near top of Bollinger range:
 The Bollinger Range.
The moving average crossover:
 Peloton Moving Average Chart.
 Peloton Chart.
The overarching conclusion?
Leave a comment