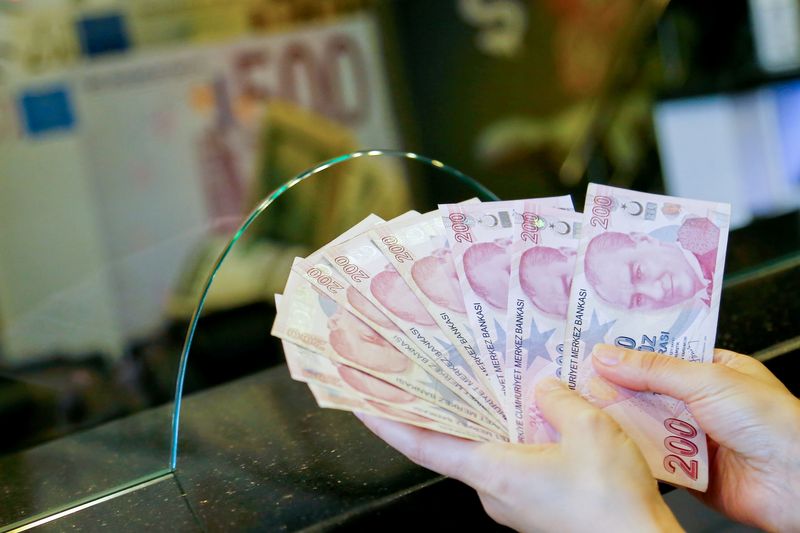
© Reuters. FILE PHOTO: A money changer holds Turkish lira banknotes at a currency exchange office in Ankara, Turkey September 27, 2021. REUTERS/Cagla Gurdogan
By Saikat Chatterjee and Karin Strohecker
LONDON (Reuters) – The Turkish lira suffered a historic 15% fall on Tuesday in a session marked by thin trading volumes and dwindling liquidity, and gauges are pointing to more rocky times ahead.
Below are four charts depicting trading on a watershed day for the lira.
FROM FLOWS TO TRICKLES
The number of trades thinned out dramatically as the lira plunged to its record low of 13.45 to the dollar on Tuesday, data over the past week showed. The amount of deals peaked during that period when the lira stood at just under 10 to the dollar.
Price swings in thinning volumes are a classic sign of a market freezing up, with market makers shying away from offering trading liquidity while end-users are panicking to transact at any available prices.
Graphic – Lira trades: https://fingfx.thomsonreuters.com/gfx/mkt/zgpomkxoapd/liratrades.png
Graphic – Lira Volumes: https://fingfx.thomsonreuters.com/gfx/mkt/byvrjkwgeve/liravolumes.png
SOARING VOL
Implied volatility gauges for lira/dollar – indicating expected fluctuations ahead – on Tuesday raced to their highest level since Turkey’s 2018 currency crisis. The lira reversing some of its losses on Wednesday saw only a small pull back in implied volatility, showing that investors are betting on more swings ahead.
Derivative markets signal a dearth of option liquidity, with the fact that traders are shying away from large directional bets further exacerbating the price swings.
Graphic – Lira volatility: https://fingfx.thomsonreuters.com/gfx/mkt/jnvwexdmavw/Lira%20volatility.JPG
WIDENING GAP
Volatility in the lira is unlikely to end soon. Market gauges for longer-term measures of lira volatility suggest traders expect a rocky road ahead. One-year implied volatility indicators compared to one-month maturities are showing their widest gap since 2018.
Graphic – Lira volcurve: https://fingfx.thomsonreuters.com/gfx/mkt/akvezmwbnpr/liravolcurve.JPG
Fusion Media or anyone involved with Fusion Media will not accept any liability for loss or damage as a result of reliance on the information including data, quotes, charts and buy/sell signals contained within this website. Please be fully informed regarding the risks and costs associated with trading the financial markets, it is one of the riskiest investment forms possible.

