So Powell finally used the F word: Froth. Being non specific though as one would expect and being super careful as to not overtly link monetary policies to the said froth we can note some faint sense of recognition on the side of central bankers that the liquidity avalanche they have unleashed has resulted in market distortions.
Most notable, the Fed’s Kaplan who said late last week:
“We are now at a point where I’m observing excesses and imbalances in financial markets.”
Kaplan told the Montgomery Area Chamber of Commerce in a virtual appearance in front of a live audience, pointing to “historically” elevated stock prices, tight credit spreads, and surging house prices.
He’s starting to sound like me. And like me he’s not a voting member on the FOMC board this year, hence he can afford to make derelict statement such as this:
“I do think, at the earliest opportunity, I think it would be appropriate for us to start talking about adjusting those purchases,” referring to the Fed’s $120 billion in monthly bond buys that, along with near-zero interest rates, are aimed at keeping financial conditions super-easy and bolstering the recovery.
Never mind that the earliest opportunity was during last week’s Fed meeting. But no, silence. Yet the Fed is finally admitting there’s some froth:
Not a moment too soon I guess. For froth is what the data is screaming from the rooftops:
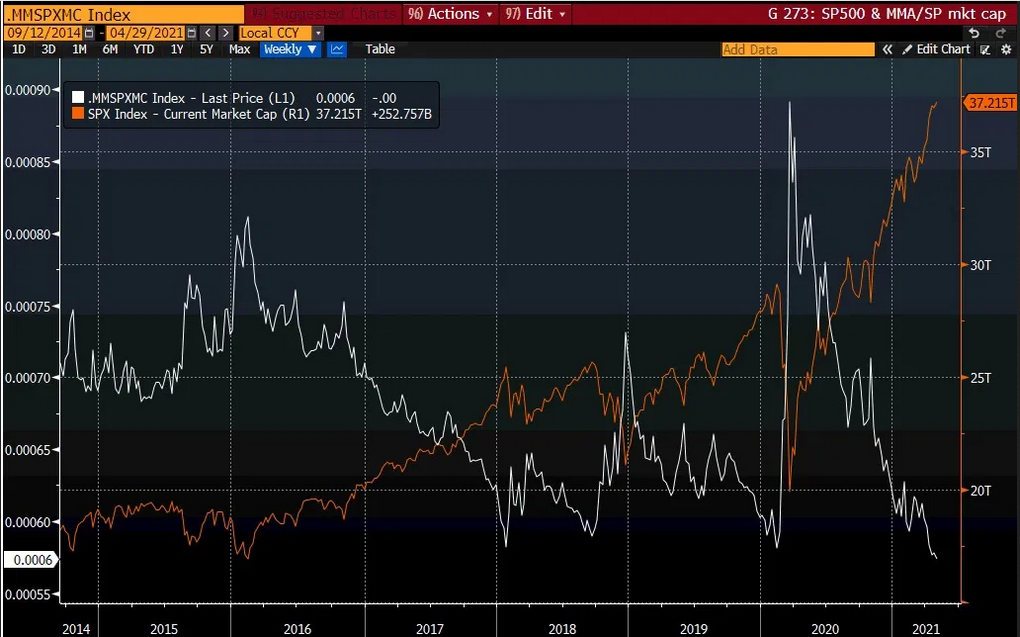
Money market fund data shows everyone is all in long while valuations are the most extreme ever:
Sentiment as expressed by headlines:
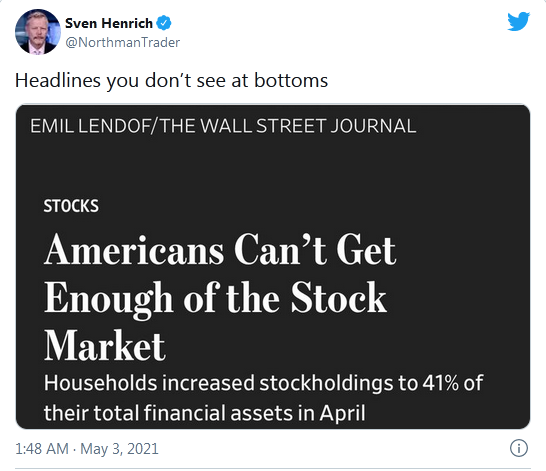
Sven Henrich Tweet
Backed up by actual data:
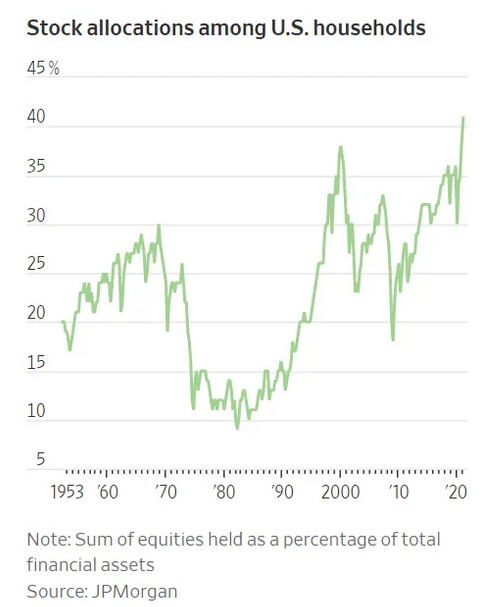
Stock Allocations Among US Households
Never have investors been this long stocks. Never have they had so much of their financial wealth tied to the future performance of stocks.
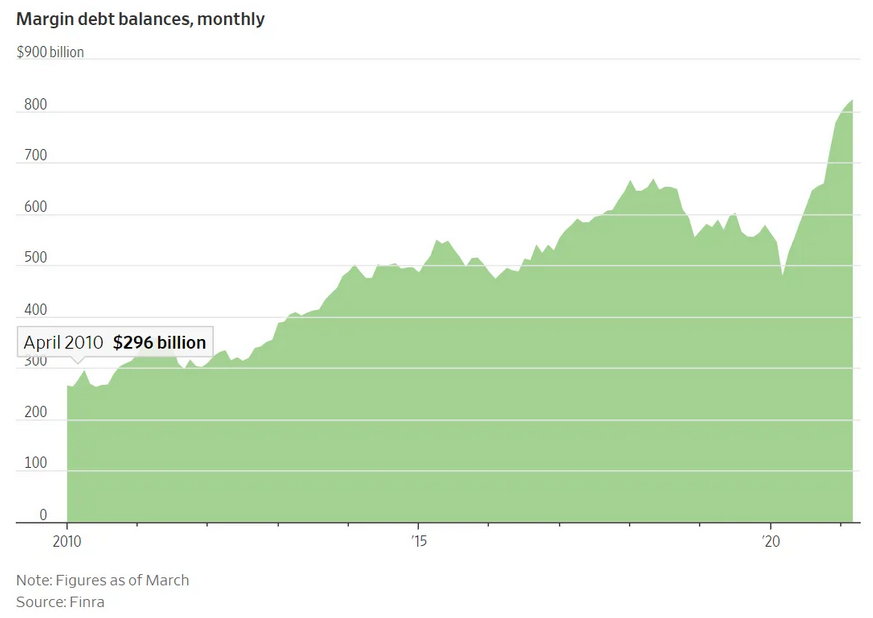
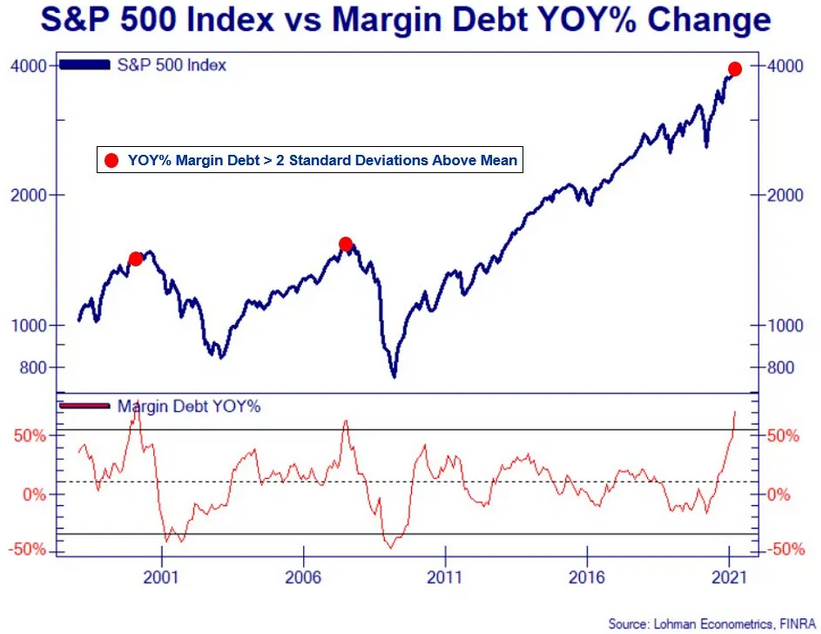
And margin debt as an expression of leverage employed tells its own horror story:
The wealth gap keeps expanding as last year’s trend just got exacerbated this year:
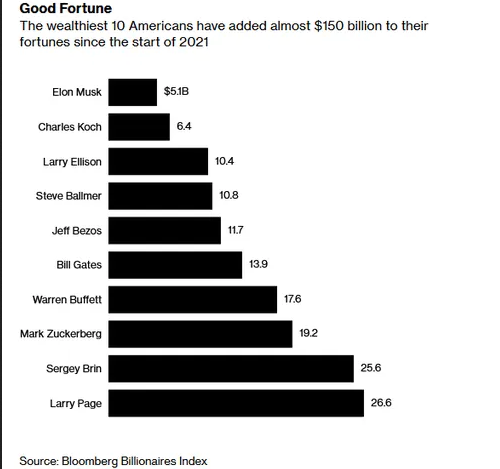
Accumalated By Richest 10 Americans
The big keep getting bigger and as a result the concentration of the few controlling everything gets ever more narrow:
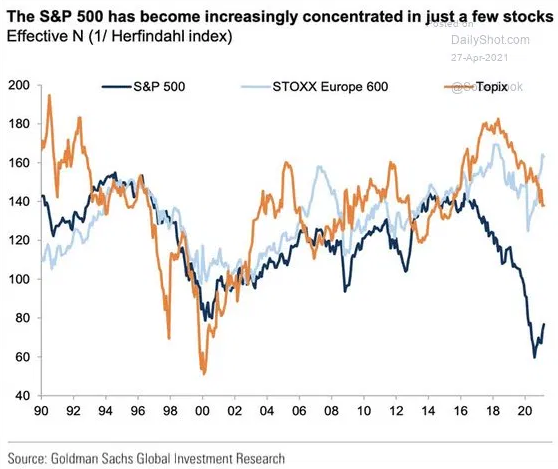
S&P 500 Chart
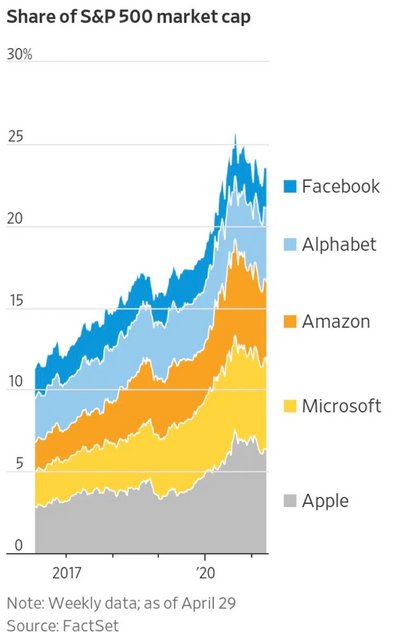
Share Of S&P 500 Market Cap
Add Tesla (NASDAQ:) to the mix and you’re north of 25% in just a few stocks again tying market fortunes to nothing breaking to the future success story of the very few.
I’ve been clear that from my perch the Fed is overdoing it and to keep printing in this environment is just policy recklessness:
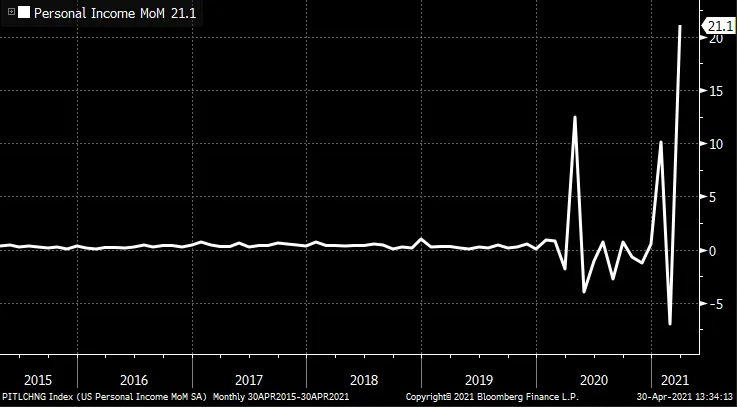
There is too much liquidity in the system and it is being allocated in reckless ways, furthering the market distortions we are witnessing now. None of these growth figures we see now will be sustained and my worry is the Fed is really screwing this up, for if they lose control of inflation and/or we are ending up with a colossal crash all these happy days may make way for a structural depression. Is this beginning of the roaring 20’s as so many believe? Or are we already in the tail end of this gilded age as non stop money printing has been with us now for 12 years already? The distortions didn’t just begin in the past 12 months after all.
I don’t know who has a grasp on reality here. Maybe Kaplan who’s admitted to the distortions.
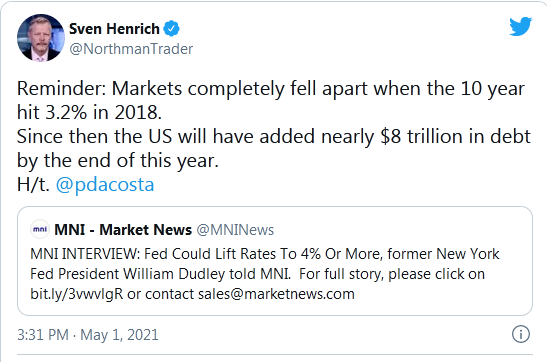
Maybe it’s Dudley, but he’s throwing out numbers that suggest an overt collapse of the debt construct to come:
Tweet
It certainly is not our ‘savior’ Powell who recklessly keeps pressing the print button. Powell who famously denied the Fed’s role in inequality all the while getting richer with is all long ETF portfolio while he drives by the homeless camp every day on his way to work & then virtue signals about it.
That’s the world we live in. And yes, it’s the biggest bubble we’ve ever seen:
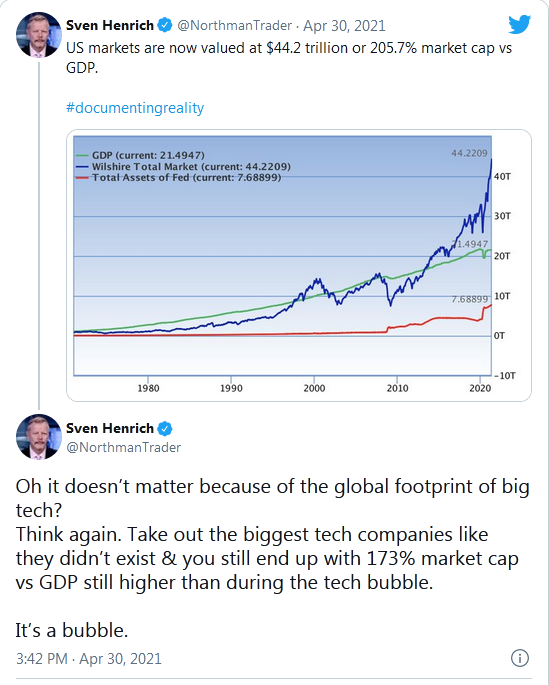
US Markets – Market Cap Vs GDP
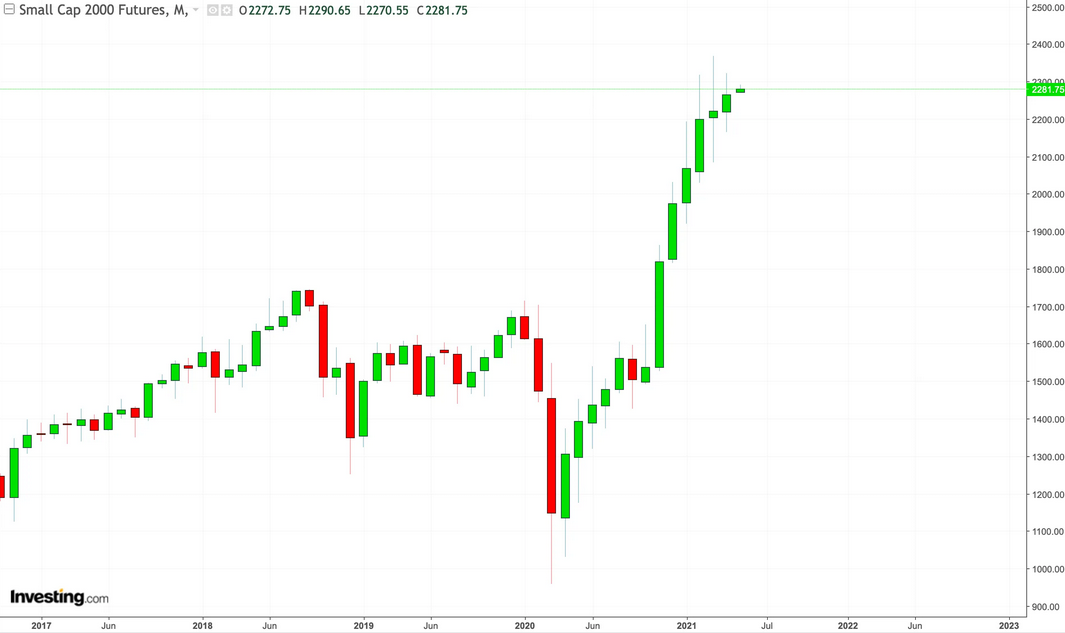
Which is what happens when asset classes of all sorts explode vertically month after month. See the examples of small caps and the latest hot hand in crypto land, :
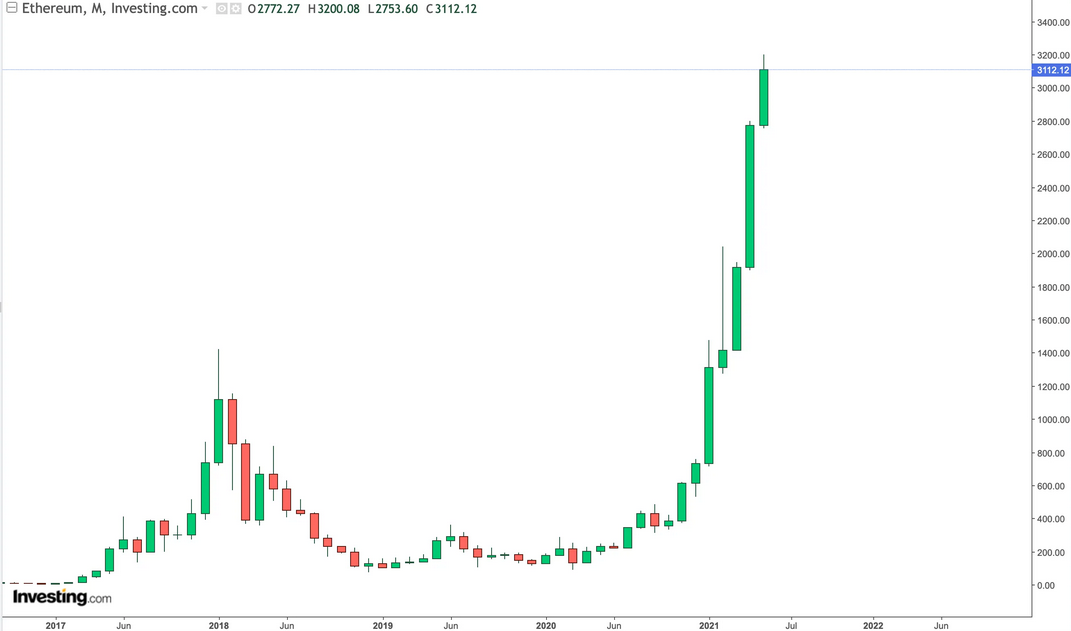
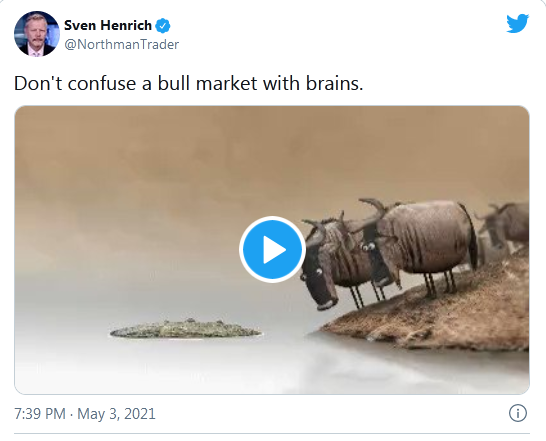
Anyone having outlined the case for a correction so far, bulls and bears alike, have found themselves out bulled by a market that has defied historical correlations and measures of reason. That’s what bubbles do. You could’ve been totally correct calling the tech bubble in 2000 as unsustainable in the fall of 1999 only to look the fool for a few months, yet being correct all along. Momentum continues to run until it burns itself out and reality sinks in.
Remember:
Tweet
And yet sell signals abound in context of a technical profile that continues to show risk higher until something breaks:
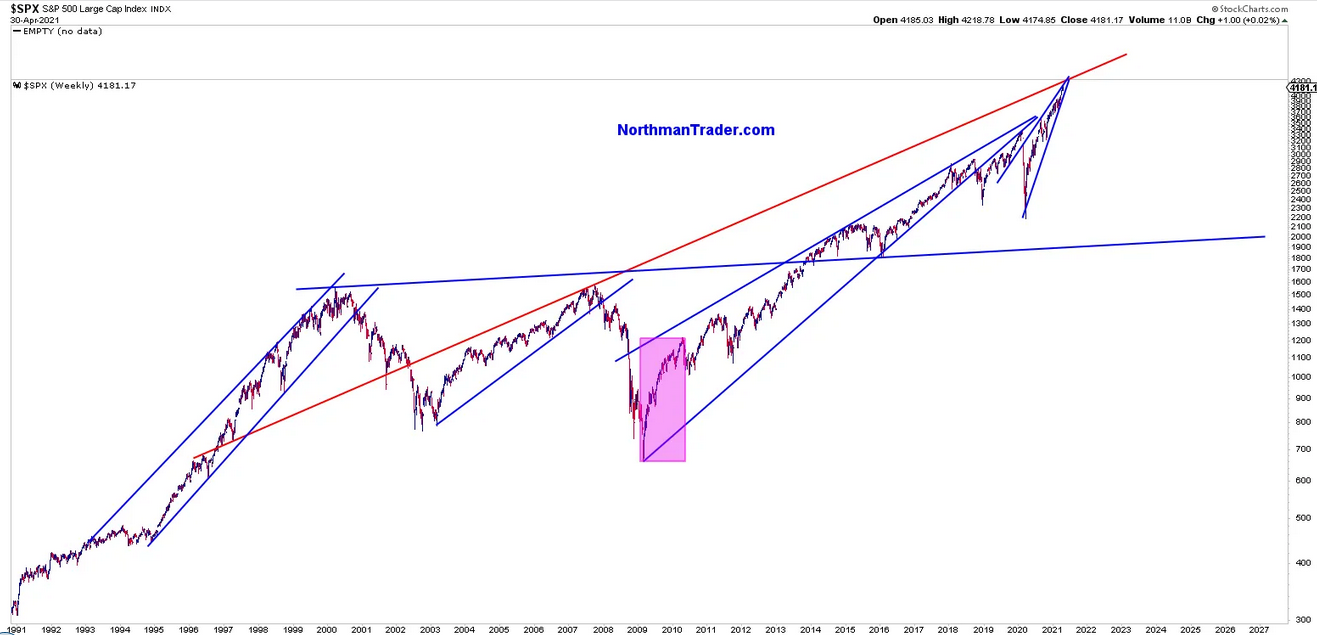
For reference that upper trend line in red sits around SPX 4287 at the moment and that trend line is rising.
Yet one of those sell signals is subtle and technical and still very much unconfirmed, that of a weekly black reversal candle on SPX last week:
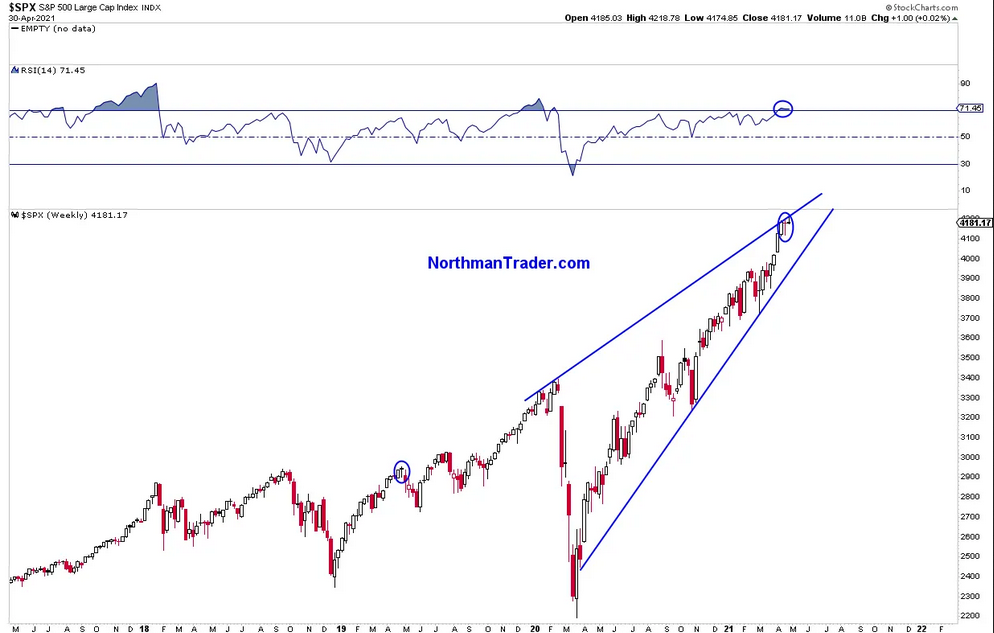
So far this week SPX has yet to make a new high, and perhaps this signal will invalidate itself as others have under the sheer force of the unrelenting liquidity and sentiment machine. We’ll know more by the end of this week.
For now be cognizant of the fact that this market is full of ever’s: The most disconnected disconnected from the economy ever, the most long positioned ever, the most margin debt levered ever. The most uncorrected ever. That’s a lot of ever’s that hardly can afford a misstep.
The Fed’s excuse for maintaining the largest QE continuing program in history increasingly looks to be politically motivated as opposed to economic. As the economy shows sign of inflation and overheating a nightmare scenario is building: Too much liquidity having caused an outright asset bubble and outright casino effect accompanied by record over-levering of extreme long stock allocations risking a market corrective process that could go a lot deeper than anyone can fathom right now as selling could beget selling and becomes systemic once the rug gets pulled (for whatever reason).
The Fed doesn’t want to be the trigger for that hence it’ll will cautiously virtue signal with the F word rather than risk being blamed for the fall out with the T word, that of tapering.
So the Fed is trapped, held hostage by its own narrative as Mohamed El-Erian points out. The problem of course being:
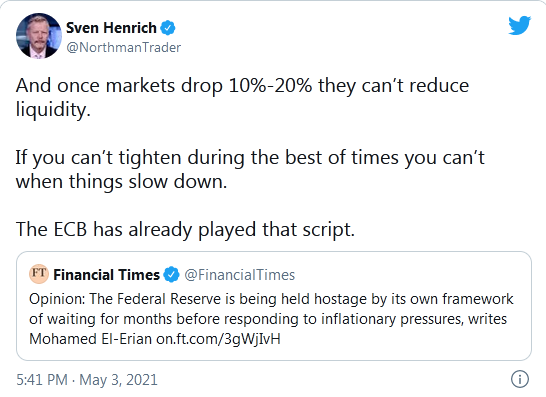
Tweet
These markets have been on liquidity autopilot for many weeks. Don’t forget we’ve seen even this movie before, think 2018:
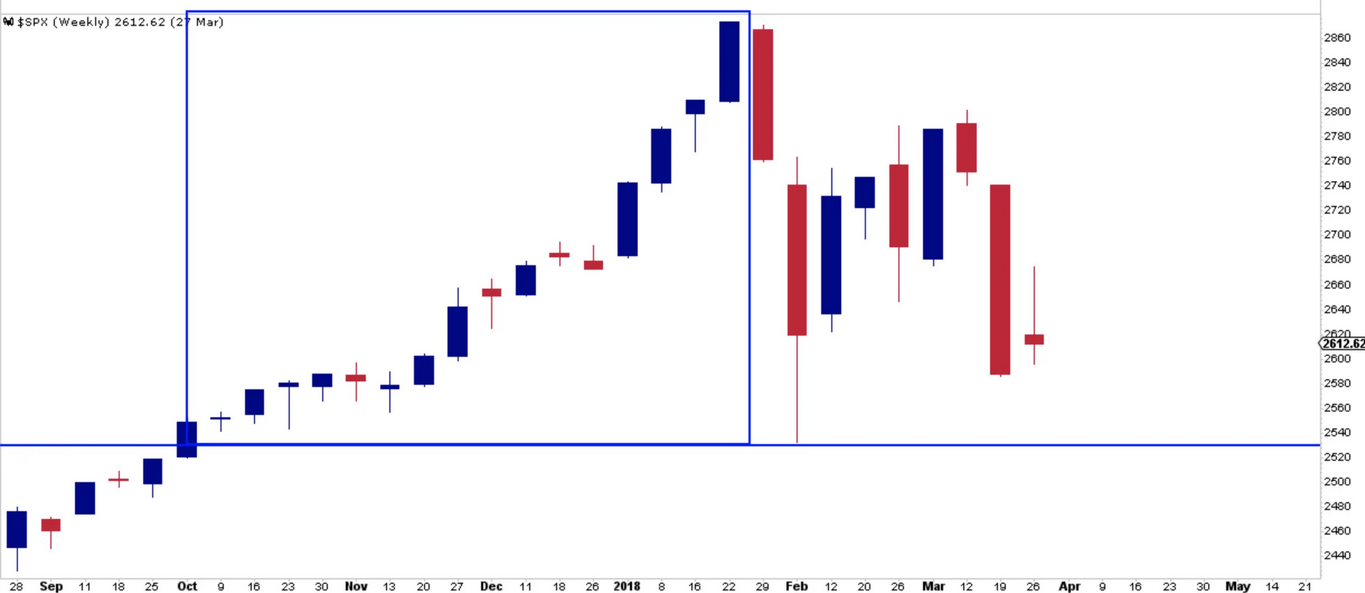
16 weeks of buying were taken out in less than 2 weeks. Stuff happens. So don’t be surprised if it does again. This party is wearing thin.


