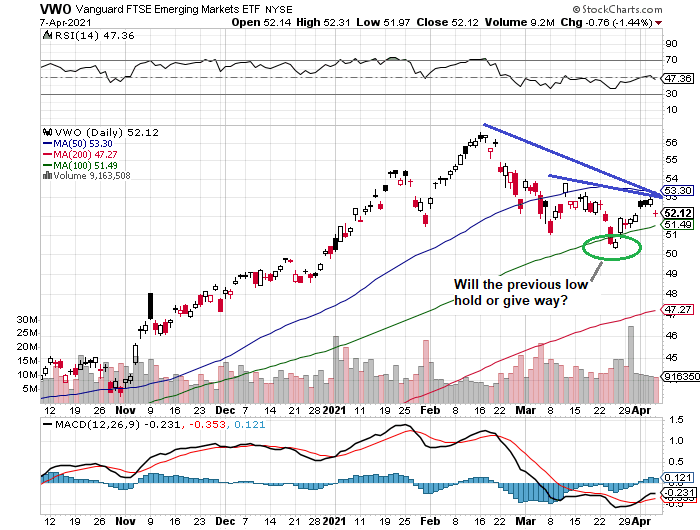
the potential for an extended haircut in Vanguard FTSE Emerging Markets Index Fund ETF Shares (NYSE:) appeared to be bubbling. The financial gods, however, laughed at the idea and the ETF subsequently bounced. Game over? Not yet, since the rally looks unconvincing.
After yesterday’s hefty 1.4% slide, recent price action suggests we’re looking at a brief rally within a longer downside move. Notably, each of the previous two rallies have fizzled at lower peaks and Wednesday’s action doesn’t suggest a change of pattern.
The next price point to watch: the $50.64 close on Mar. 25. If that gives way, it could signal more selling.

Looking through the daily noise, however, leaves room for debate. The weekly data still point to an ongoing phase of consolidation after a strong rally over the past year.
Deciding if the EM on a temporary pause in an ongoing run higher vs. a reversal may depend on the next phase of interest rate moves. The rise in the benchmark , Treasury yield, for example, hasn’t been productive for EM generally.
As the IMF noted earlier this week, higher rates are a headwind for EM. Although that’s true for stocks generally, at least under some circumstances, EM is thought to be particularly vulnerable to higher borrowing costs.
“Emerging and developing economies are viewing rising interest rates with trepidation. Most of them are facing a slower economic recovery than advanced economies because of longer waits for vaccines and limited space for their own fiscal stimulus.
“Now, capital inflows to emerging markets have shown signs of drying up. The fear is of a repeat of the ‘taper tantrum’ episode of 2013, when indications of an earlier-than-expected tapering of US bond purchases caused a rush of capital outflows from emerging markets.”
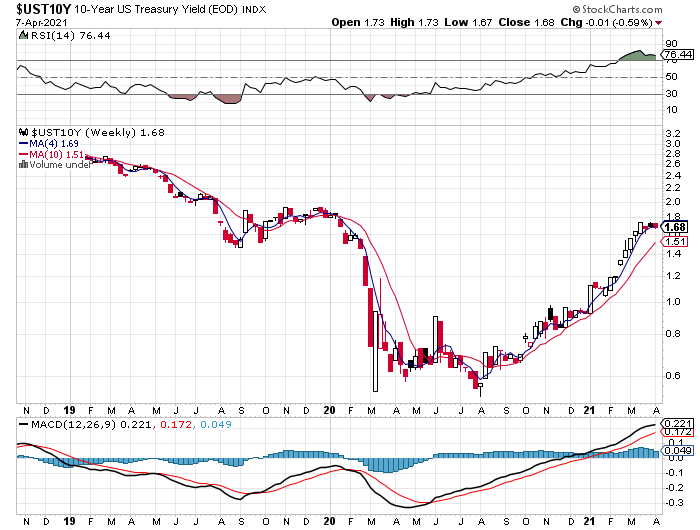
The good news for EM is that the rise in the rate has taken a holiday recently, as the weekly chart below shows. If the rate breaks above the 1.74% ceiling reached in March, however, VWO could swoon once more.

What would drive US interest rates higher? Strength in the incoming economic data is on the short list of possibilities, especially on the inflation front.
In the days ahead, two scheduled reports deserve close attention. First up is today’s weekly update on . Economists are looking for a moderate drop to 680,000 (s.a.) for last week. That’s still sky high relative to history, but it’s close to a pandemic low. If correct, the news will refocus minds on the healing trend that’s unfolding in the economy, which in turn implies higher rates, if only on the margins.
A potentially bigger market-moving event: next Tuesday’s consumer inflation data for March. is projected to jump sharply to 2.4% year-over-year rate (a pandemic high), according to the consensus forecast via TradingEconomics.com. is on track to remain lower, although here too the trend is expected to strengthen to a 1.5% annual pace from 1.3% previously.
Hotter inflation may be a temporary scenario as the US economy continues to rebound from the pandemic. Regardless, EM will remain on the defensive if the reflation bias rolls on.

