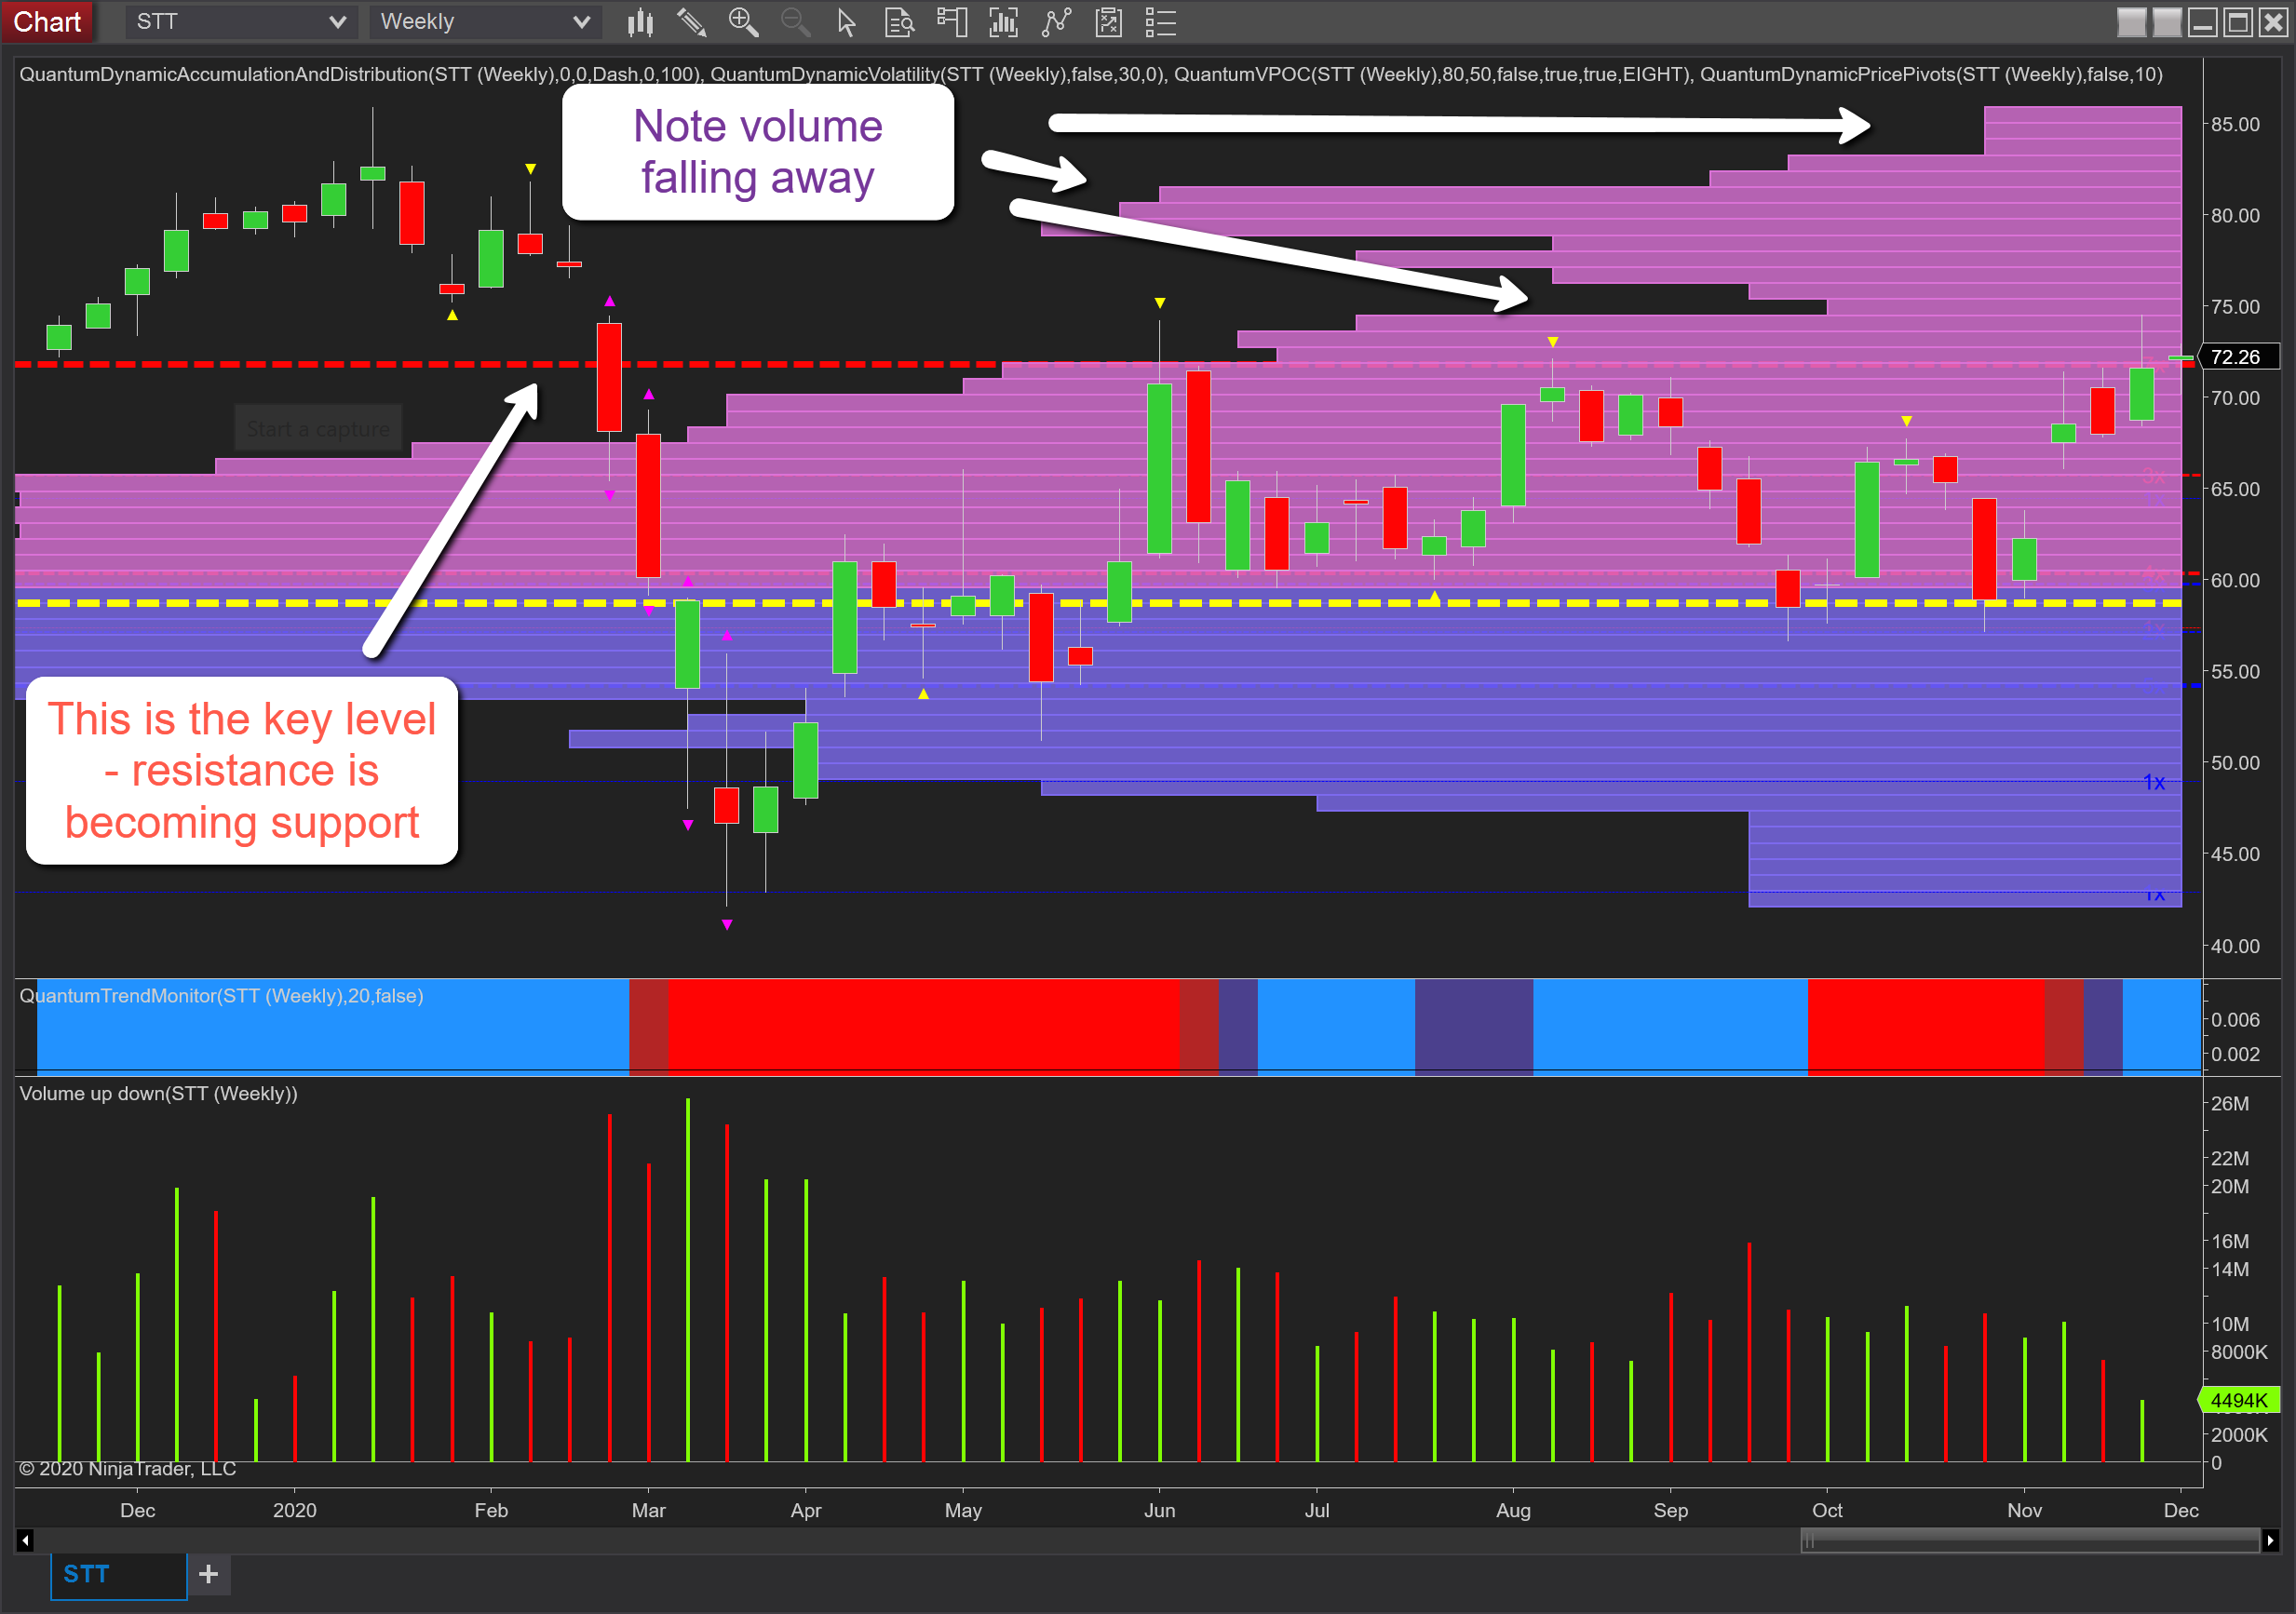
The weekly chart for State Street (NYSE:STT), one of the oldest banks in the US and headquartered in Boston, is now approaching an interesting point and for longer-term investors certainly, one to add to the watch list and once again this chart is all about levels, and in particular that at $72 per share which is the one which catches the eye.
 STT-Weekly Chart
The accumulation and distribution indicator presents these levels for us according to the number of times they have been tested and retested, and rather like Popeye and his spinach, each time they are tested and hold, the indicator increases their thickness giving us a clear and immediate picture of key support and resistance levels. In this case, it is one of resistance that has capped this stock repeatedly since early summer, whilst the VPOC, (the volume point of control) the yellow dashed line, has provided an equally strong level of support along with other minor levels adding their own weight.
Yesterday’s price action saw the stock hold above the ceiling of resistance before closing at $72.26, and in so doing, gives the first hint that this level is about to be breached decisively and if so, we then have an extremely broad platform of support in place below to act as a springboard for a sustained move higher in the longer term with a move towards $85 per share and beyond.
As we can see volume-based resistance on the VPOC histogram falls away as we move towards $75 per share with a low volume node here and hence we can expect to see the price move easily through this region and on towards $80 per share where historic volume builds once more. So in summary, a stock that has the potential to move firmly higher in the medium term provided we hold above the old ceiling of resistance and is associated with rising volume as the trend develops.
Leave a comment