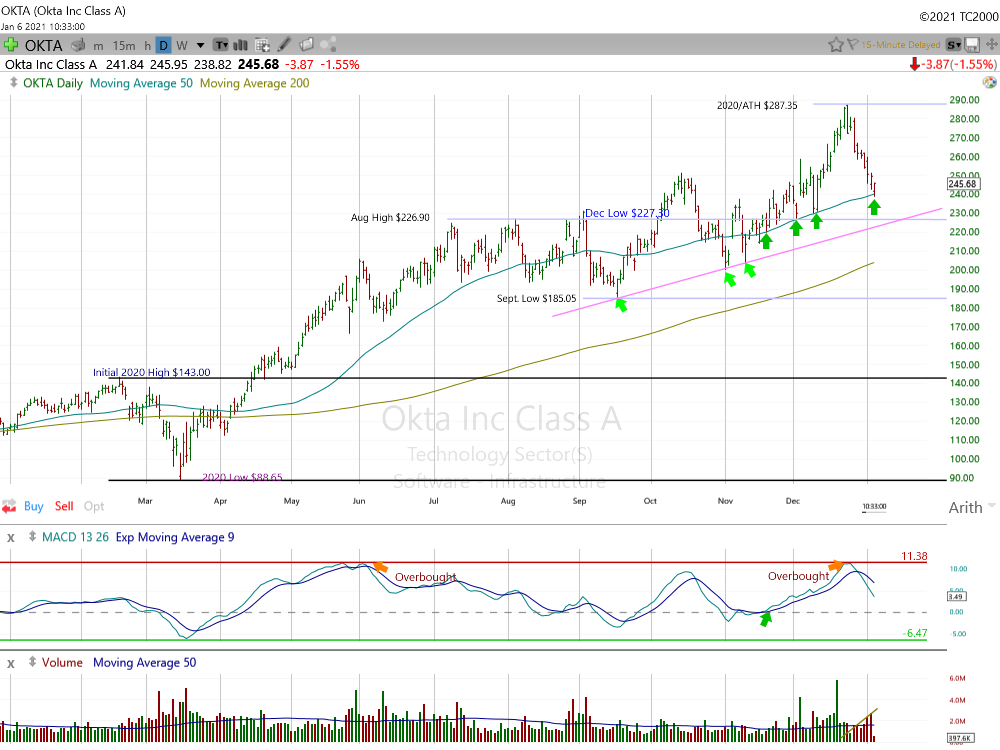
 Okta Daily Chart.
At the December peak shares of Okta Inc (NASDAQ:OKTA) had gained 222% from the March lows. From early July until early November the stock moved sideways. OKTA began November well below the summer highs and right in the middle of its previous five-month range. Shares began a fresh rally leg on 11/10 and by mid-December the stock was trading at new all time highs. Total gain from the 11/10 low was 41%.
Shortly after the Nov. 10 lows the 50-day moving average became a solid support level. It held back to back weekly lows in December after providing footing in late November. The final leg of the rally in mid December drove shares back into overbought territory. As a finishing touch, the stock traced out a key downside reversal after printing all-time highs on Dec. 23rd. OKTA began its current pullback that day and is working on its 8th straight lower high. At today’s early low the stock is off 16% from the highs.
OKTA is retesting its 50-day moving average today and is beginning to show signs of stabilization. The overbought MACD has been worked off considerably. Is the pullback over? Too early to tell but entry is certainly much more low risk now than it was two weeks ago.
On the downside, a close back below $227.00 would violate the December lows sending a clear warning sign that a much consolidation will be needed before OKTA is ready to begin a fresh rally leg.
Note: We are long OKTA in our Tactical Opportunity Portfolio.
You can read Gary S. Morrow's original post here.
Leave a comment