Traders are starting to worry about the strength and continuity of the recent rally in the US stock market recently. Our research suggests the US stock market reflation trade is still Bullish and may surprise many traders.
Fibonacci Measured Moves Target $2753 in MidCaps
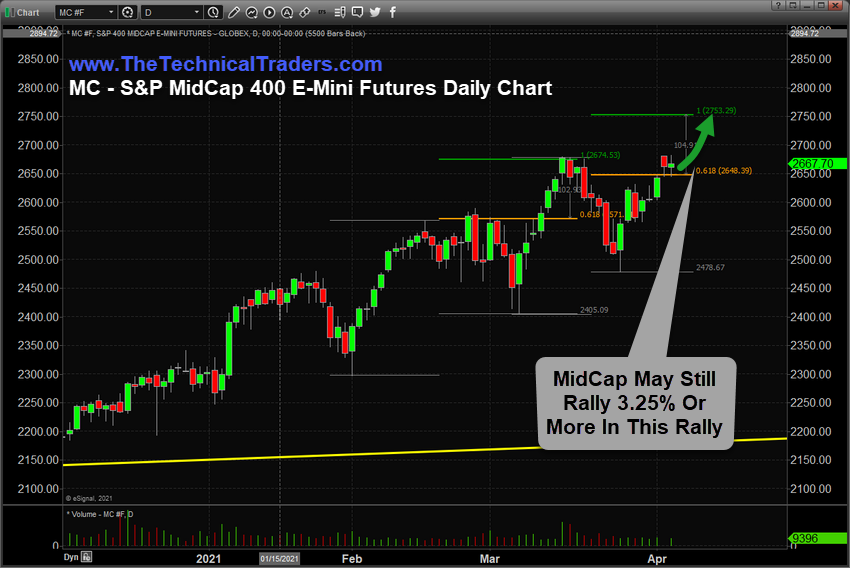
This example of the S&P500 MidCap 400 E-Mini Futures Daily chart highlights the recent series of Fibonacci Measured Moves that continue to reach the 100% expansion target. The current Fibonacci Measured Move targets the $2753.29 level – nearly 3.5% to 4.5% higher than current price levels.
A continued upside price move in the MidCap would prompt a further rally in other US major stock indexes. For example, if our research is accurate, a further 2% to 5% or more is likely in the , and .
Global Reflation Trade May Surprise Many Traders
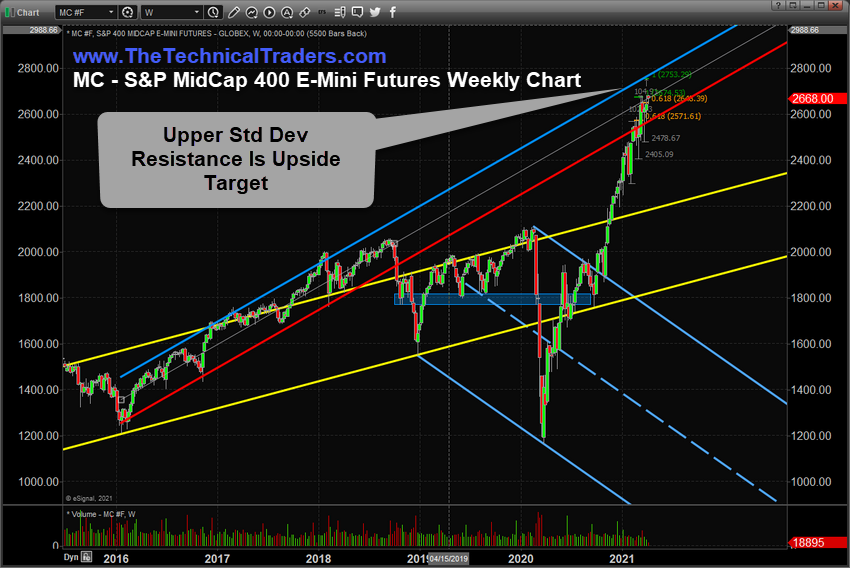
Many traders fail to consider the amount of stimulus, policy spending, and the reflation capability of a global market that is emerging from COVID constrictions. If we took into consideration the standard deviation range of the rally from 2016 to the peak in 2018, the $2380 level on the MC would equal the upper range of that Standard Deviation channel in the current price. This suggests the current US market has simply reflated to levels equal to previous price trends.
The following Weekly MC chart highlights key price channels, trends and shows the Standard Deviation channel we are referencing related to key price resistance. Once price reaches this upper channel, it may continue to trade within the Standard Deviation range in a “melt-up” manner for many weeks.
What is important to understand about this reflation trade is that global markets have already priced in forward expectations for most of 2021. As long as earnings continue to support forward guidance and continued reflation of the global economy, the stronger will attract foreign investment into the US stock market – much like what we’ve seen over the past 3 to 4+ years. Weaker foreign currencies and weaker foreign markets pull capital into the US market as a means to negate currency pressures and to create profits.
This shift in how capital is deployed may prompt a continued price rally in the US stock market for many more weeks or months. It all depends on how Q1:2021 earnings fair and how the US Dollar continues to trend. This suggests traders should be prepared for another round of strong trending if our research is correct.
Enjoy the rest of the week!!!
Fusion Media or anyone involved with Fusion Media will not accept any liability for loss or damage as a result of reliance on the information including data, quotes, charts and buy/sell signals contained within this website. Please be fully informed regarding the risks and costs associated with trading the financial markets, it is one of the riskiest investment forms possible.


