The media is buzzing with claims of an “Economic Boom” in 2021. While the economy will most certainly grow in 2021, the question is how much is already “baked in?”
“The economy has entered a period of supercharged growth. Instead of fizzling, it could potentially remain stronger than it was during the pre-pandemic era into 2023.
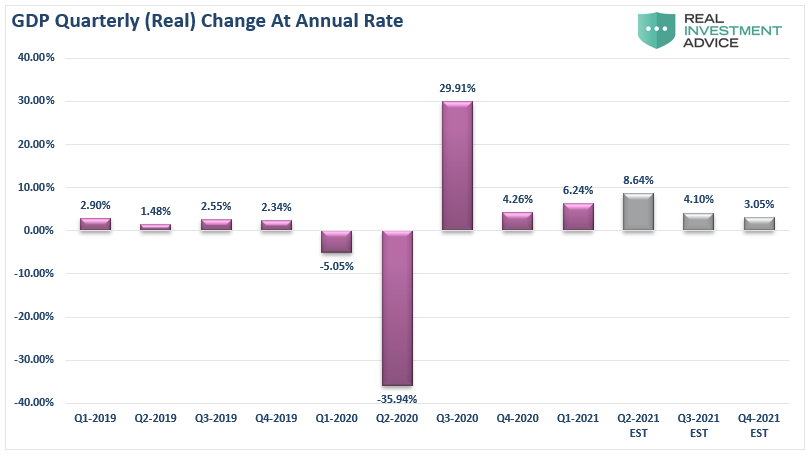
Economists now expect the second quarter to grow at a pace of 10%, and they expect growth for 2021 to be north of 6.5%. In the past decade, only a few quarters gross domestic product growing at even 3%.”
The premise is that strong “pent up” demand will sustain the economic recovery over the next few years.
However, since market lows in 2020, the market surge has not only recouped all of those losses but has rocketed to all-time highs on expectations of surging earnings growth.
The question: How much has gotten priced in?
A Return To Normalcy
Just recently, Liz Ann Sonders wrote a piece for Advisor Perspectives. To wit:
“Vaccines and herd immunity continue to bring COVID cases down, and the economic reopening continues to kick into a higher gear. Such is what the data is starting to show. Across economic metrics, from the gross domestic product () to and job growth, boom conditions are evident.”
She is correct in her statement. However, there is a difference between an “economic boom” and a “recovery.” As shown in the chart of GDP growth below, the U.S. has already experienced a very sharp “economic recovery” from the recessionary lows. (I have included estimates for the rest of 2020, which shows a return to trend growth.)
The following chart shows the economic recovery against the massive dumps of liquidity pumped into the economy. (Estimates run through the end of 2021 using economist’s assumptions.)
Can’t Recoup Losses
Certain areas of the economy, like airlines, hotels, and cruise ships, have yet to recover to pre-pandemic levels. However, those industries only make up a relatively small amount of overall economic activity. Furthermore, these industries will continue to struggle for some time as individuals will not take “two vacations” this year since they missed last year. That activity is now forever lost.
Yes, the economy will recover most likely to pre-pandemic levels this year due to stimulus injections, , what then?
“The biggest problem with more stimulus is the increase in the debt required to fund it. There is no historical precedent, anywhere globally, that shows increased debt levels lead to more robust economic growth rates or prosperity. Since 1980, the overall increase in debt has surged to levels that currently usurp the entirety of economic growth. With economic growth rates now at the lowest levels on record, the change in debt continues to divert more tax dollars away from productive investments into the service of debt and social welfare.”
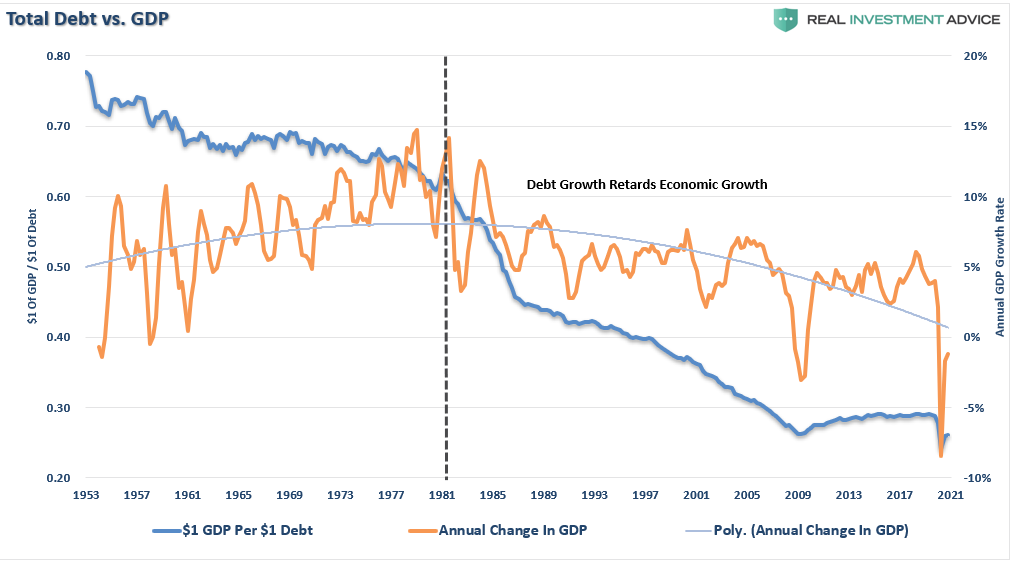
Just as it is with investing, getting “back to even” is not the same thing as “organic growth.”
The Second Derivative
What is shown above is the “second derivative” effect of growth.
“In calculus, the second derivative, or the second-order derivative, of a function f is the derivative of the derivative of f.” – Wikipedia.
In English, the “second derivative” measures how the rate of change of a quantity is itself changing. Since we measure GDP growth on an annual rate of change basis, the larger the economy grows, the lower the rate of change will be. Here is a simplistic example go GDP growth:
In year 1, GDP = $1. In the second year, GDP grows to $2. The annual rate of change is 100%. However, in year 3, even though the economy grows to $3, the annual rate of change falls to just 50%.
Given the long-term historical correlation between economic growth, corporate earnings, and annualized returns, the reversion to trend growth has implications for investors. As Liz notes:
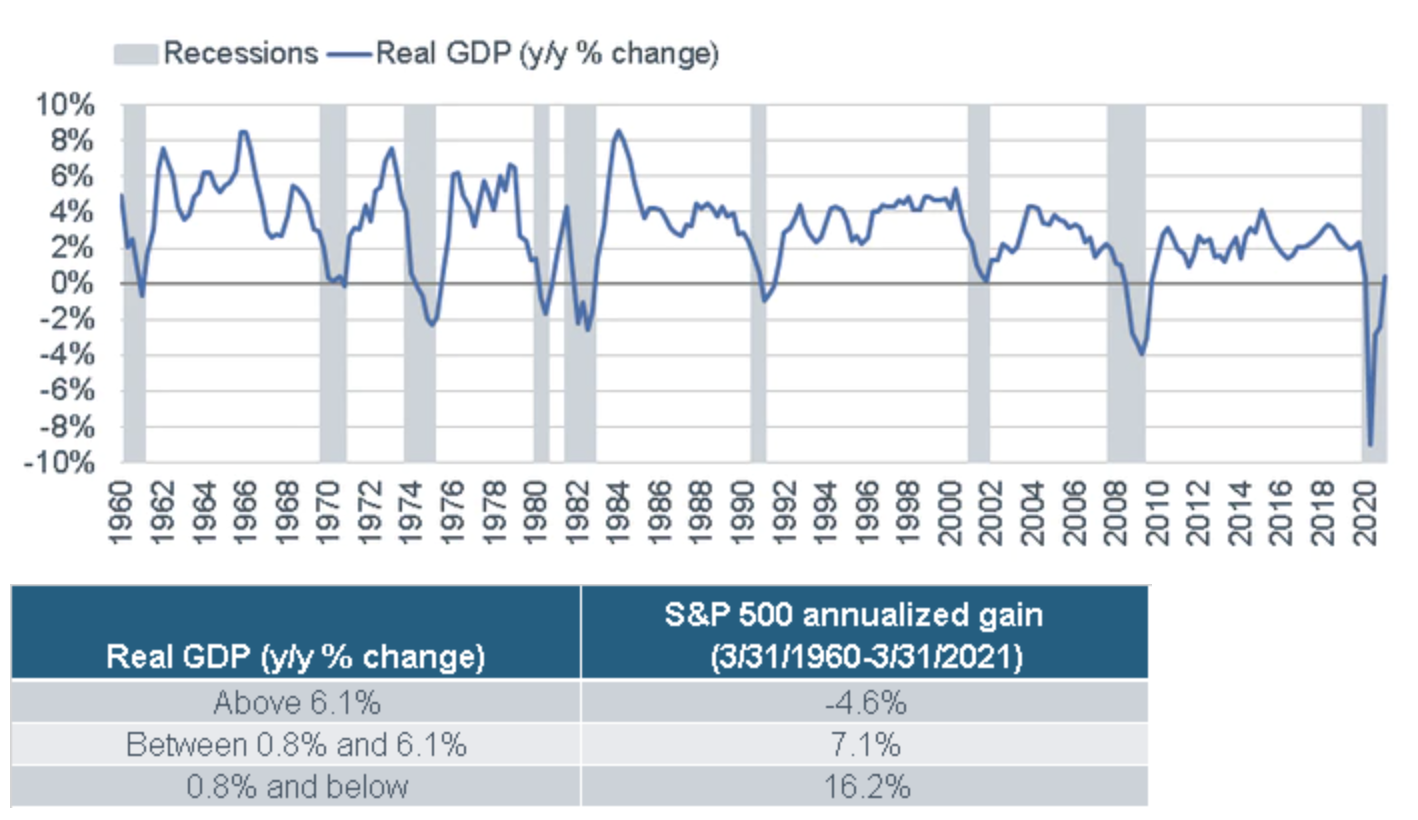
“Using three broad ranges for GDP growth historically, the lowest range (when the economy is barely growing or in recession) is accompanied by the highest annualized stock market performance. GDP is only slightly back into positive territory on an annualized basis. However, the strong growth expected in the second quarter will push GDP into the highest zone. At that level, stocks have historically posted a negative annualized return.”
The reason is that once economic growth reaches higher levels, stocks have climbed to levels incorporating those expectations. In other words, when things are as “good as they can get,” stocks begin to reprice for slower future growth rates.
That is the phase we are at currently.
How Much Pent Up Demand Is There Anyway
The main driver of the expected recovery from a “recessionary” low stems from the question of how much “pent up” demand currently exists?
If we look at durable goods as an example, such would suggest that much of the demand for long-lasting products got pulled forward by consumers over the last 12-months.
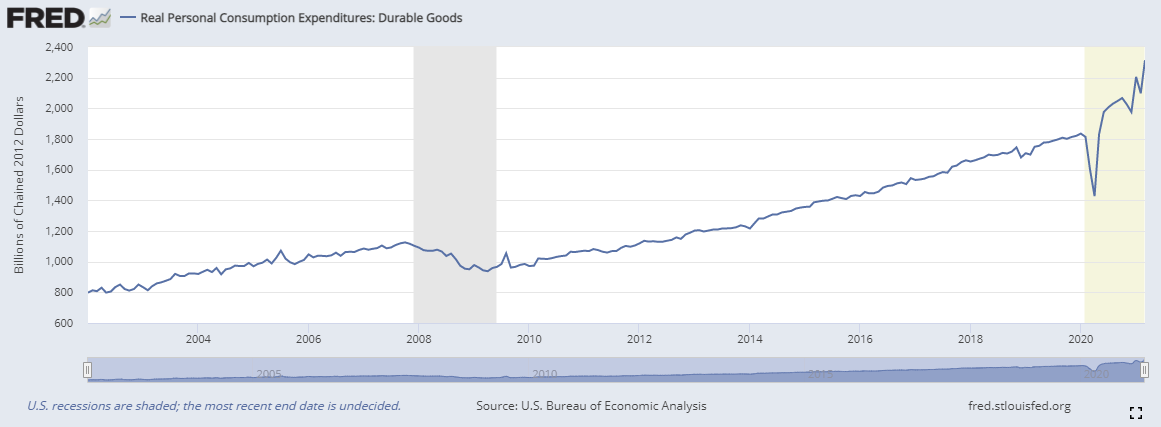
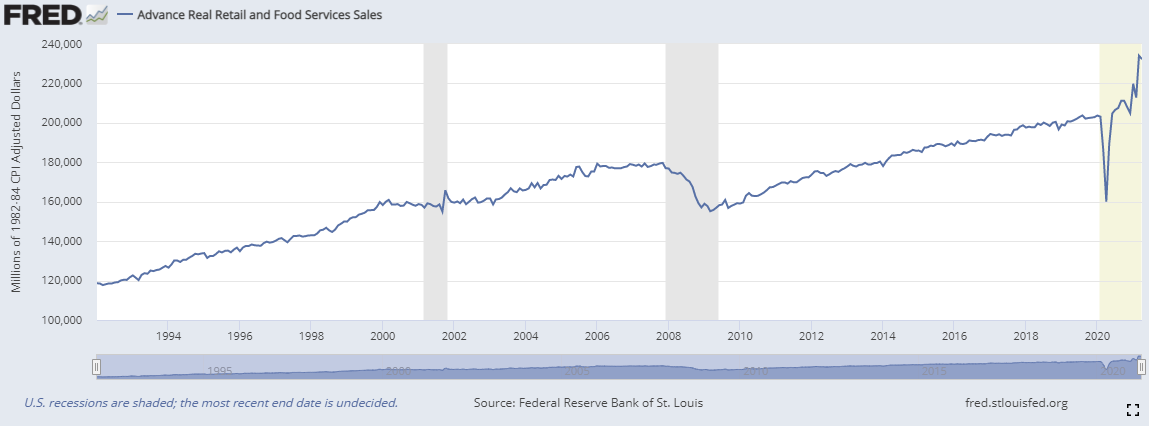
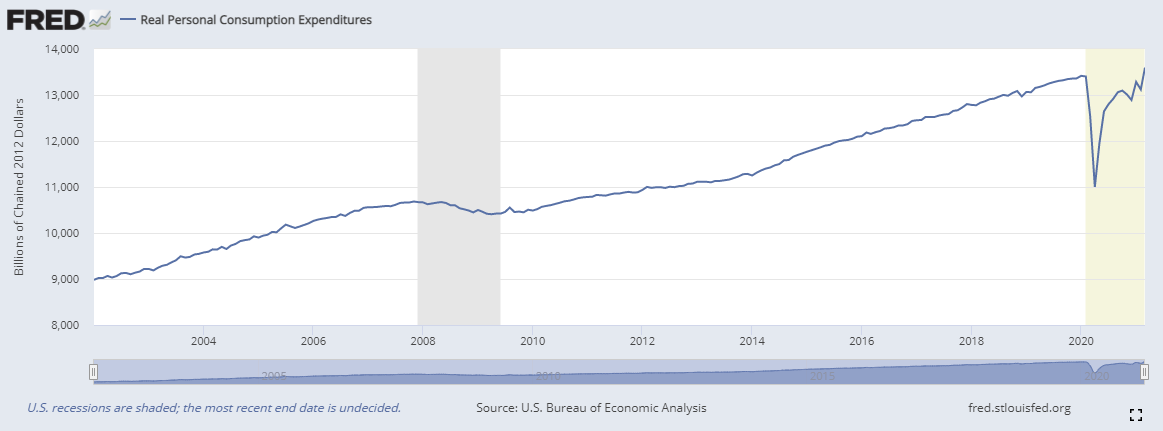
Of course, if we broaden that measure to retails sales which make up ~40% of the personal consumption expenditures () index, we see much the same.
Given PCE, which comprises nearly 70% of GDP, has already recovered much of pandemic-related decline, how much “pent up” demand remains.
However, wage growth outside of personal transfer payments (i.e., stimulus) hasn’t recovered. It is impossible to sustain higher rates of economic growth without wage growth.
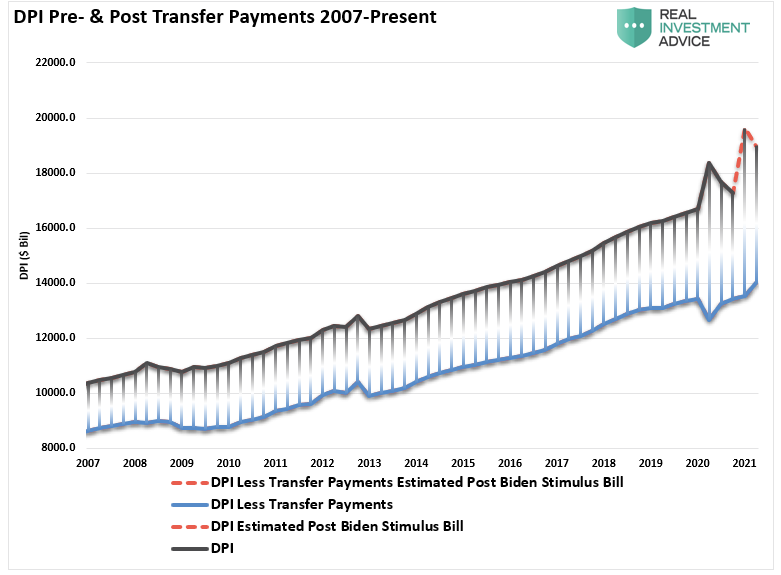
Importantly, as we saw in January and February following the $900 billion stimulus bill passage, there was a short-lived surge of activity. However, once individuals spent the money, activity quickly faded. We saw the same with retail sales in April following the American Rescue Plan, which sent out $1400 checks.
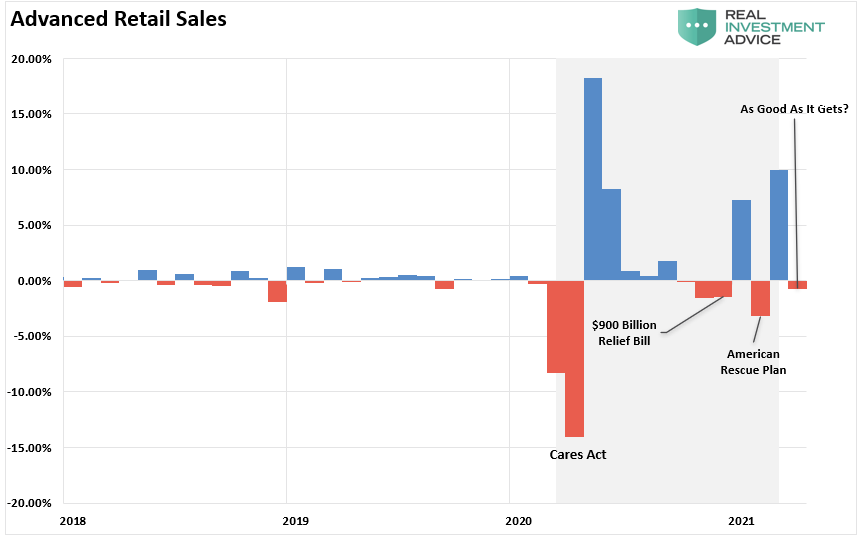
After the $1400 checks get spent, what will be the driver for continued consumption at previous rates? Further, given the impact of a larger economy (as it recovers), the rate of change will decline markedly in the months to come.
Earnings Growth Inflection
“Earnings growth has a high correlation to stock market performance, but with time lags that are less well-understood. We are about halfway through the first quarter earnings season and so far, the results are exceptionally strong.” – Liz Ann Sonders
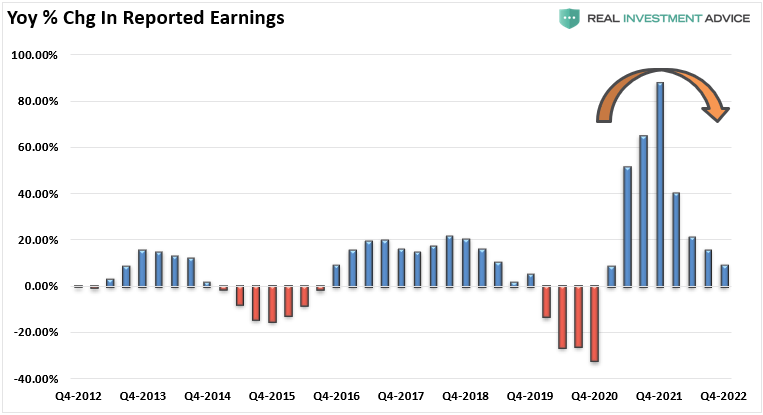
That is correct, and given the high correlation between earnings and market returns, we come back to the same question. Has the advance in the market accounted for the rebound in earnings? More importantly, what happens when that growth reverses?
“Relative to last year’s second-quarter plunge of nearly -31% year-over-year, expectations are that S&P 500 earnings will be up more than 46% in this year’s first quarter. The second quarter will boast a whopping 60% increase. Such should be the inflection point in terms of the year-over-year growth rate.” – Liz Ann Sonders

The problem is the S&P rose to levels that earnings growth will have difficulty supporting, particularly as the stimulus fades from the system. As with economic growth, the 2nd derivative of earnings growth is now a headwind for the markets.
Such is also the problem of
Conclusion
Notably, the outsized growth of the market reflects repetitive interventions into the financial markets by the Fed. Those interventions detached financial asset growth from their long-term correlation to GDP growth, where corporate revenue comes from. Historically, when the , a reversion occurred.
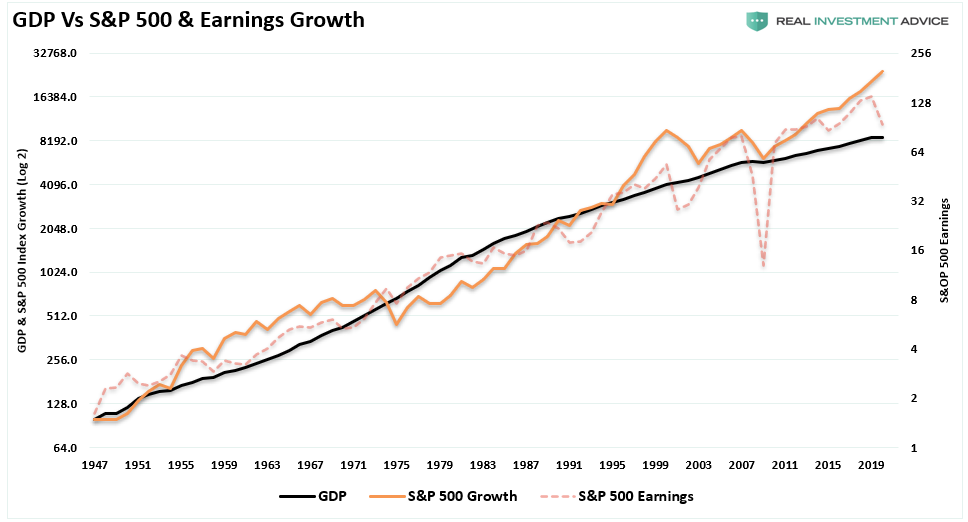
Currently, analysts are expecting earnings to surge well above economic growth rates. However, the flaw in the analysis is the assumption earnings growth will continue its current trend.
While there will be an economic recovery to pre-pandemic levels, a recovery is very different from an expansion.
As Liz concludes:
“Optimism is extremely elevated. Such is certainly justified by stock market behavior over the past year and recent economic releases. But some curbing of enthusiasm may be warranted given the history of the stock market as an uncanny ‘sniffer-outer’ of economic inflection points.”
As she goes on to point out, this is not a time for FOMO-driven investment decision-making. The reality is that the supports that drove the economic recovery will not support an ongoing economic expansion. One is self-sustaining organic growth from productive activity, and the other is not.
The risk of disappointment is high. And so are the costs of being “wilfully blind” to the dangers.


