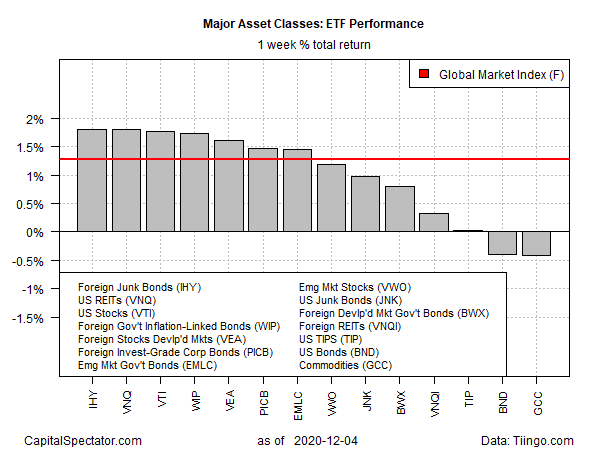
The recent bull run in the major asset classes continued last week as foreign high-yield bonds and US real estate investment trusts (REITs) shared first place for performance, based on a set of exchange traded funds for the five trading days through Friday’s close (Dec. 4).
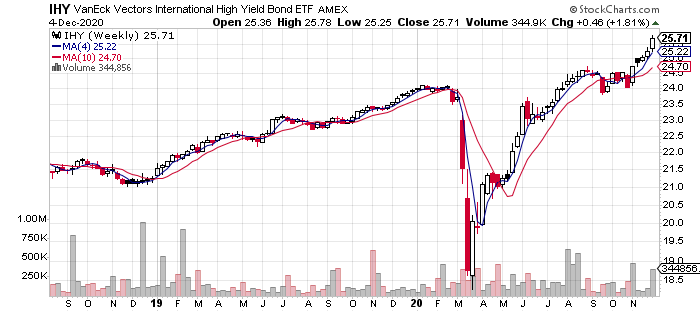
VanEck Vectors International High Yield Bond ETF (NYSE:IHY) increased 1.8%. The gain—the fifth straight weekly advance—lifted the fund to another record high, as shown in the chart below (which reflects weekly changes).
 IHY Weekly Chart
US real estate investment trusts (REITs) also increased 1.8% last week. But in contrast with IHY, Vanguard Real Estate Index Fund ETF Shares (NYSE:VNQ) remains well below its pre-pandemic levels. But there are signs of life: after moving sideways for several months, VNQ has edged higher and traded in the upper range of recent pricing.
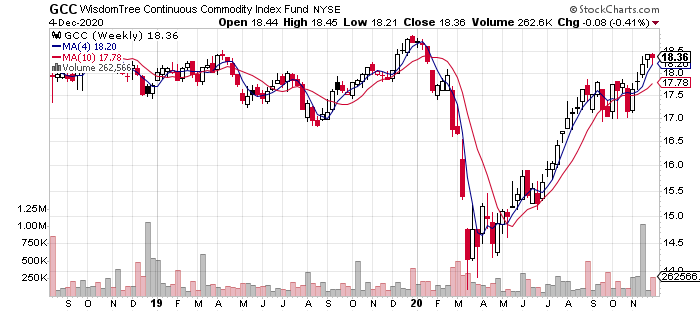
The only losers for the major asset classes last week: a broad measure of US investment-grade bonds (BND) and an ETF that tracks an expansive, equal-weighted definition of commodities. After rallying for four straight weeks, WisdomTree Continuous Commodity (GCC) slipped 0.4%.
 GCC Weekly Chart
The broad-based global rally was kind to the Global Markets Index (GMI.F). This unmanaged benchmark, which holds all the major asset classes (except cash) in market-value weights via ETFs, rose 1.3%, marking the fifth straight weekly increase.
 GMI ETF Weekly Barplots
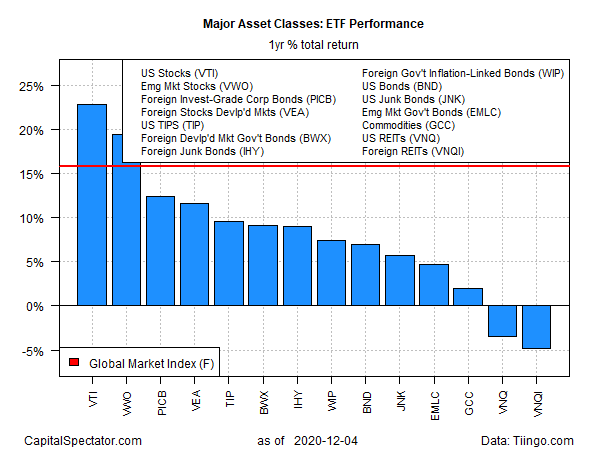
Turning to the one-year trend, US equities continue to lead the major asset classes. Vanguard Total Stock Market Index Fund ETF Shares (VTI) is up a strong 23.0% on a total return basis at Friday’s close vs. the year-ago level.
The only losers for the one-year window: US and foreign real estate shares. Vanguard Global ex-U.S. Real Estate Index (VNQI) is at the bottom for one-year results, nursing a 4.9% decline.
Meanwhile, there’s no sign of stress for GMI.F’s one-year change: the index is currently ahead by a strong 15.8% vs. the year-ago price after factoring in distributions.
 ETF Yearly Returns
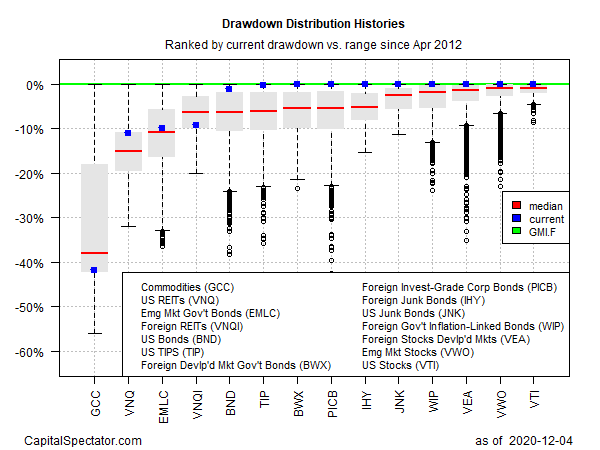
Ranking global markets by current drawdown continues to show that most of the major asset classes are at or near price peaks. The broad US stock market (VTI) continues to lead on this front after closing at a record high on Friday.
Meantime, broadly defined commodities (GCC) remain dead last for current drawdown – the fund is currently posting a peak-to-trough slide in excess of negative 40%.
GMI.F’s current drawdown is zero.
 Drawdown Distribution HistoriesOriginal Article
