The forward looking Earnings Per Share for all S&P 500 companies combined increased last week from $160.08 to $160.40.
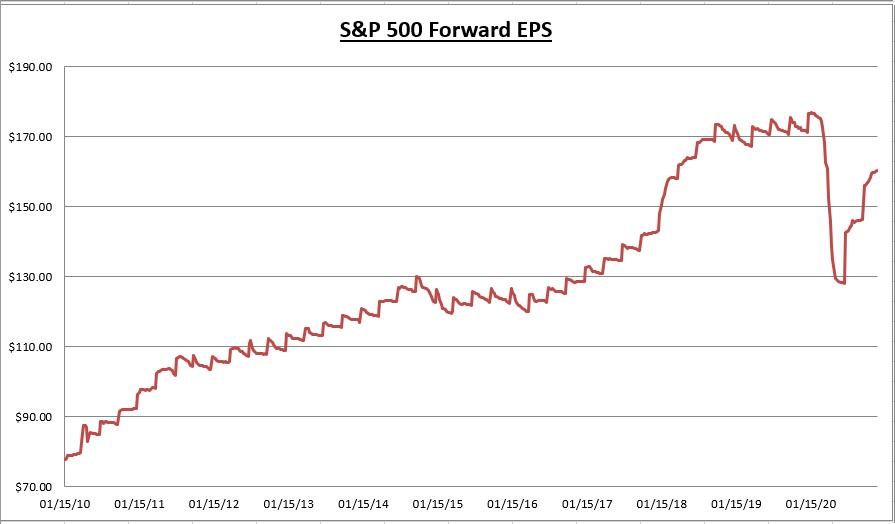 S&P 500 Forward EPS
99% of the index have now reported Q3 earnings, with 84% of companies reporting earnings above expectations, and 78% of companies reporting revenues above expectations. In the aggregate, companies are reporting earnings 19.7% above estimates.
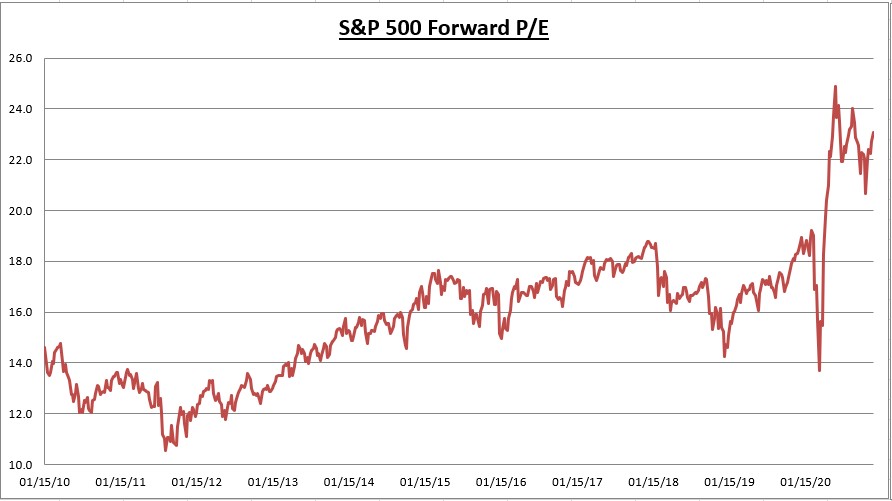 S&P 500 Forward PE Ratio Chart
The S&P 500 increased 1.67% last week. Since the index increased more than the forward EPS, the price to earnings ratio increased from 22.7 to 23.1.
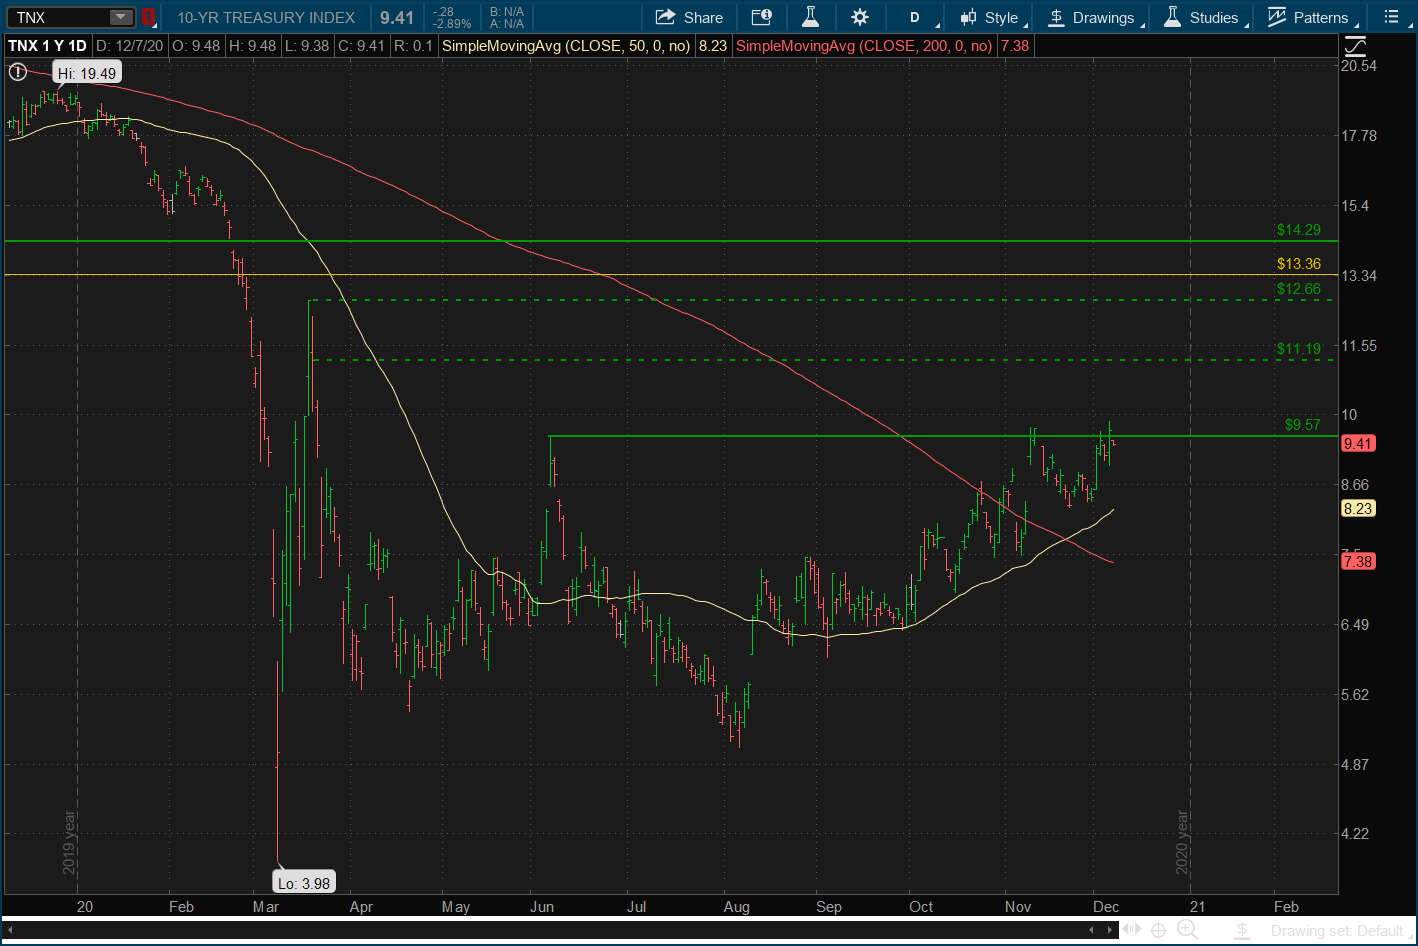 TNX Daily Chart
The 10-year treasury bond rate increased last week from 0.842% to 0.969%. A break above 0.957% would target the levels highlighted on the above chart, perhaps into the 1.3% to 1.4% range. After all this time, I still can’t believe we are talking about a move up to 1.0% on the 10 year as being a big deal. Crazy times!
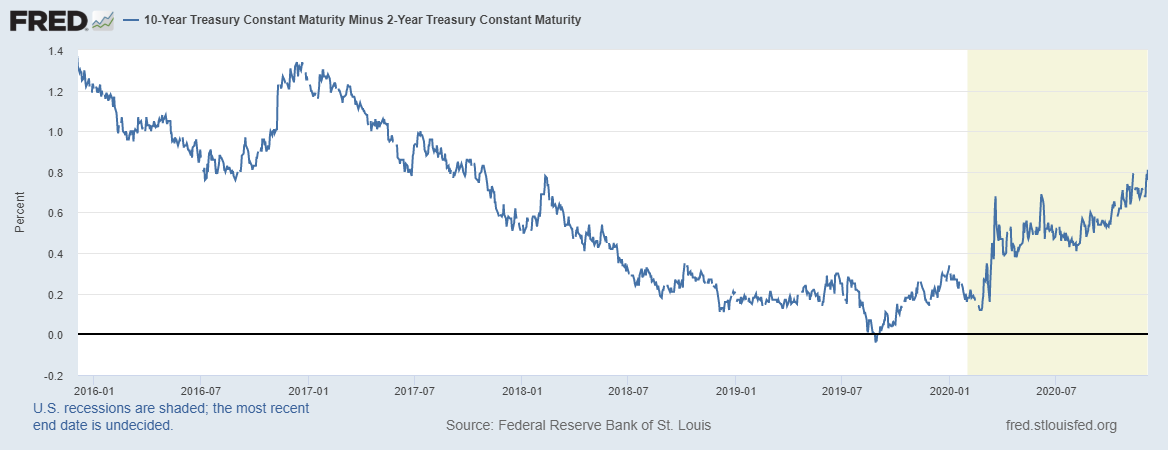 10 Yr & 2 Yr T-Note Constant Maturity
As a result, the yield curve (difference between rates on two-year treasury bonds and 10 year treasury bonds) increased to a 2 year high, at almost 80 basis points. This is good for financials.
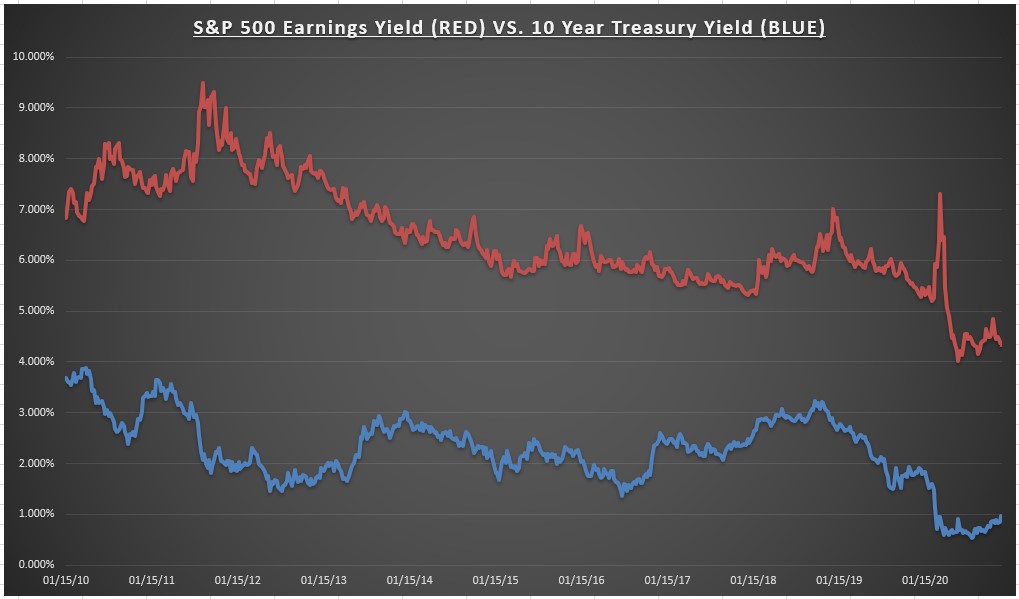 S&P 500 Earnings Yield Vs 10 Yr Treasury Yield
The earnings yield on the S&P 500 fell from 4.40% to 4.34%, while the 10 year treasury bond rate increased to 0.969%. This reduced the equity risk premium from 3.56% to 3.37%. A higher equity risk premium means stocks are more attractive than fixed income alternatives on a valuation basis. The gap narrowed a tiny bit, but still nothing of meaning.
Economic Data Week in Review
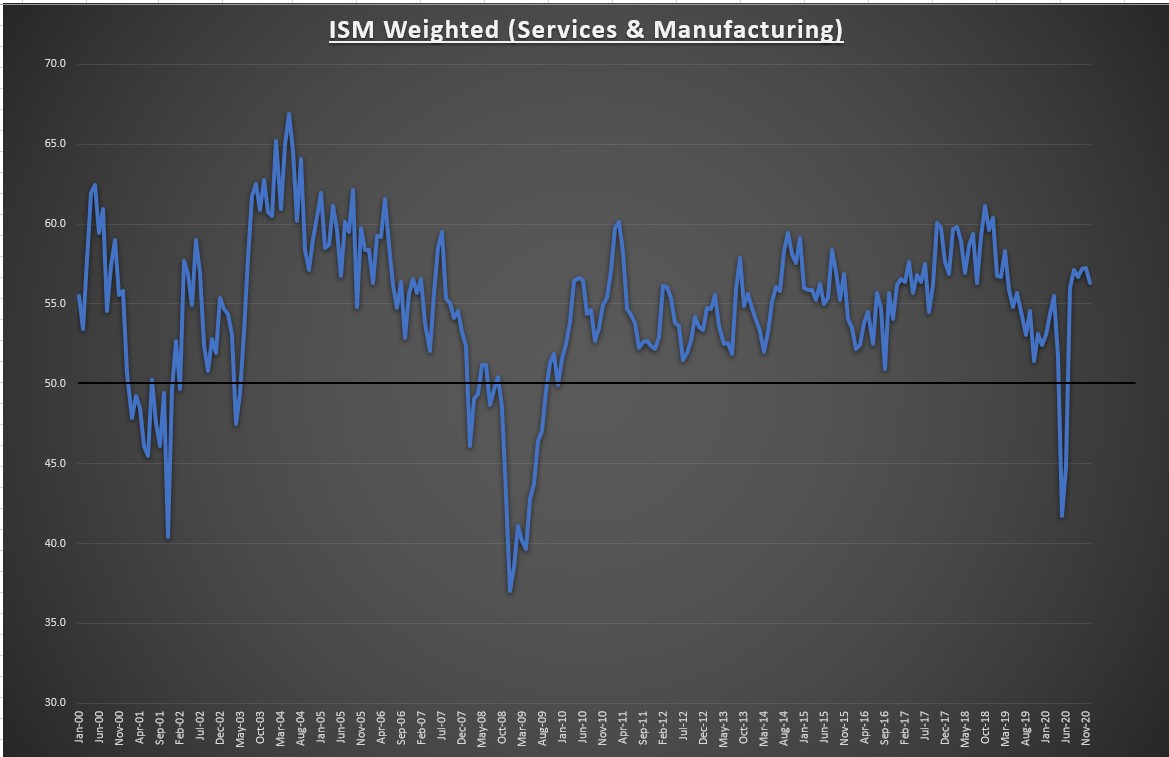 ISM Weighted (Services And Manufacturing)
Last week the ISM Manufacturing PMI came in at 57.9, while the ISM Services PMI came in at 55.9. Both numbers are indicative of solid economic growth (anything about 50 is expansionary), but at a moderated pace from the prior month.
My weighted ISM (taking into account the weights manufacturing & services have in the US economy) dipped from 57.3 to 56.3. Still well in expansionary territory, but some softness was to be expected given the implementation of moderate restrictions.
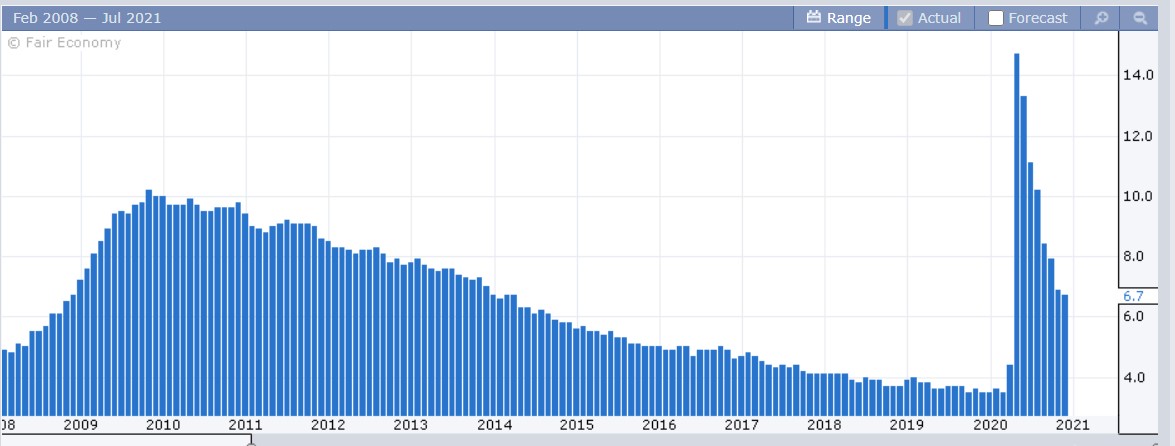 Unemployment Rate
The unemployment rate fell to 6.7%. Definitely moving in the right direction but more work needs to be done.
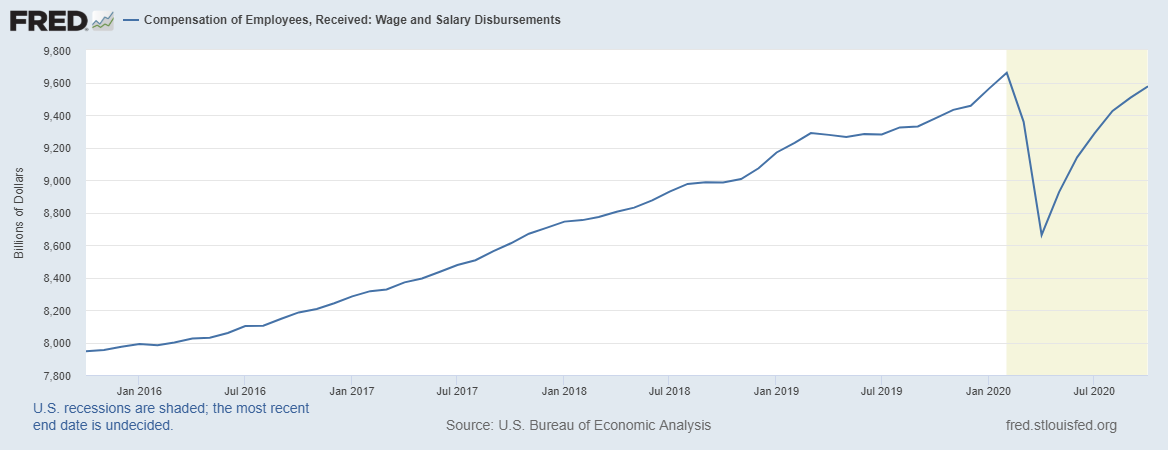 Total Wages And Salaries Graph
On a positive note, total wages and salaries is less than 1% away from pre-COVID highs. This is one missing piece of the puzzle that explains why consumer spending numbers have remained so robust despite the elapse of stimulus.
November Month in Review
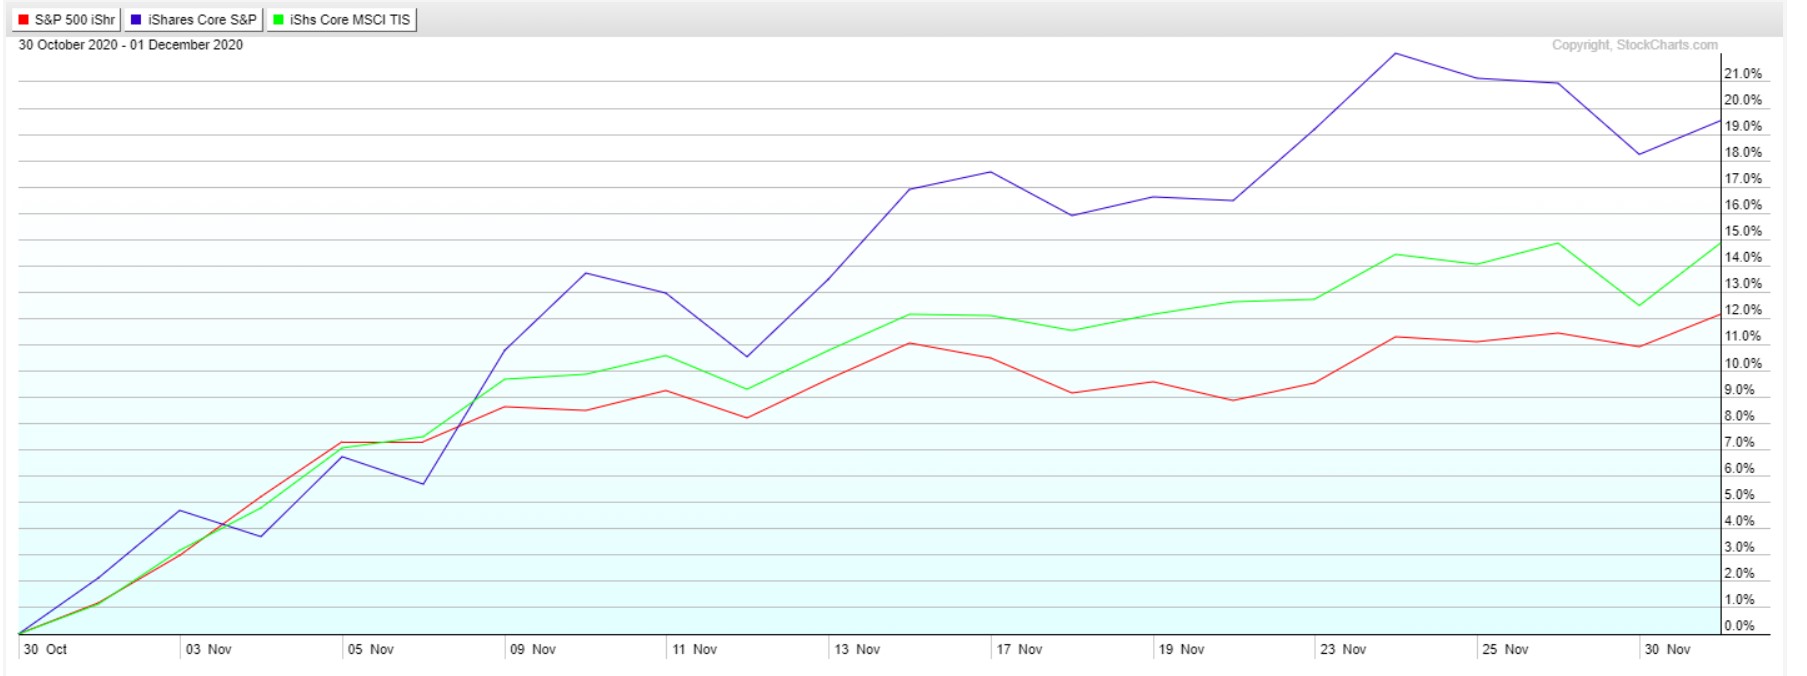 Small Cap & Internation Stock Performance Chart
November turned out to be one of the best months in 33 years. Another reason why its usually best to stay fully invested (assuming the strategy fits your risk tolerance and time horizon). Not only that, small caps and international stocks actually outperformed. Small cap US stocks rose +19.52%, international stocks rose +14.87%, while the S&P 500 rose +12.12%. Finally, a diversified portfolio worked.
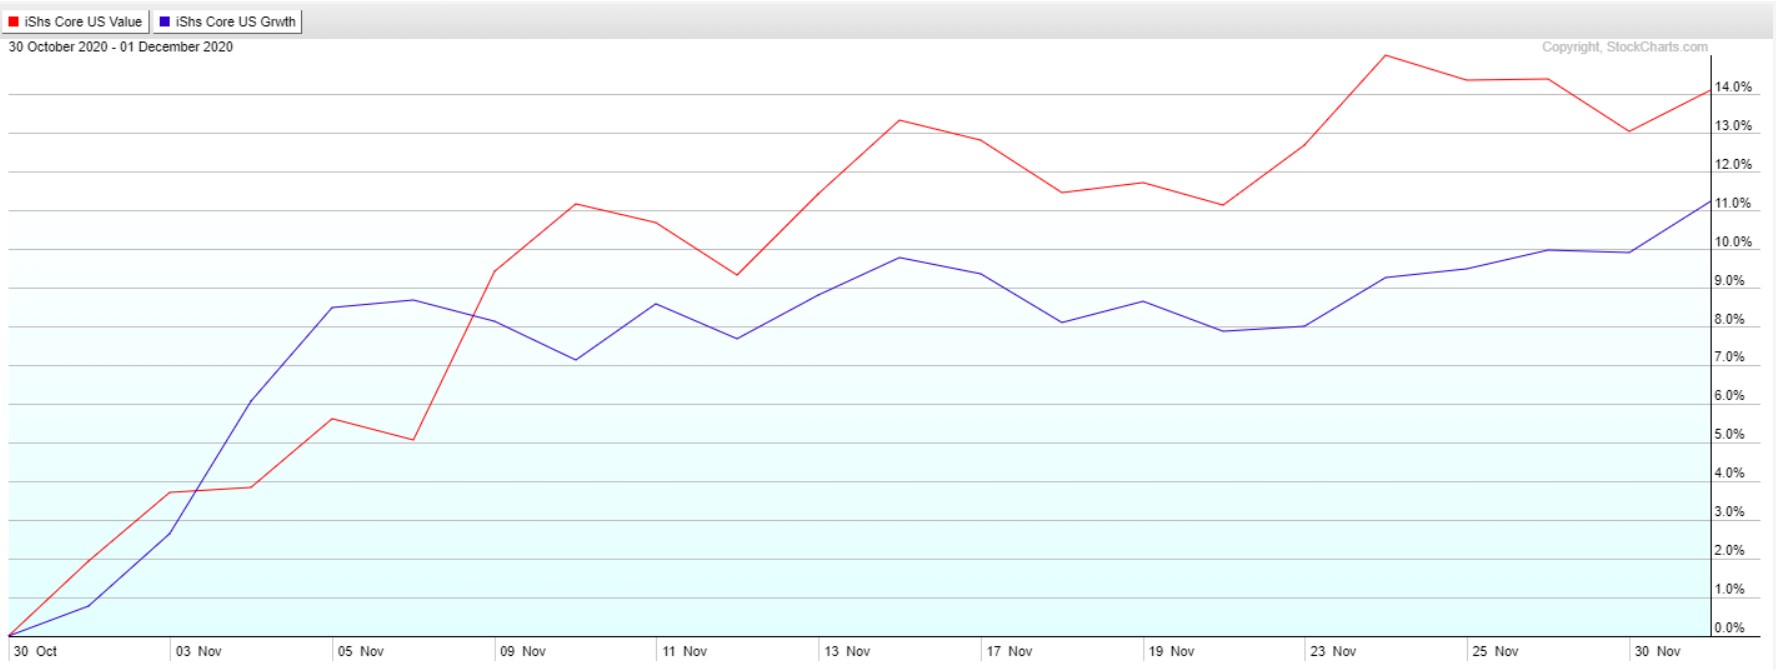 Value Vs Growth
Not only that, value stocks (+14.11%) finally outperformed growth (+11.24%).
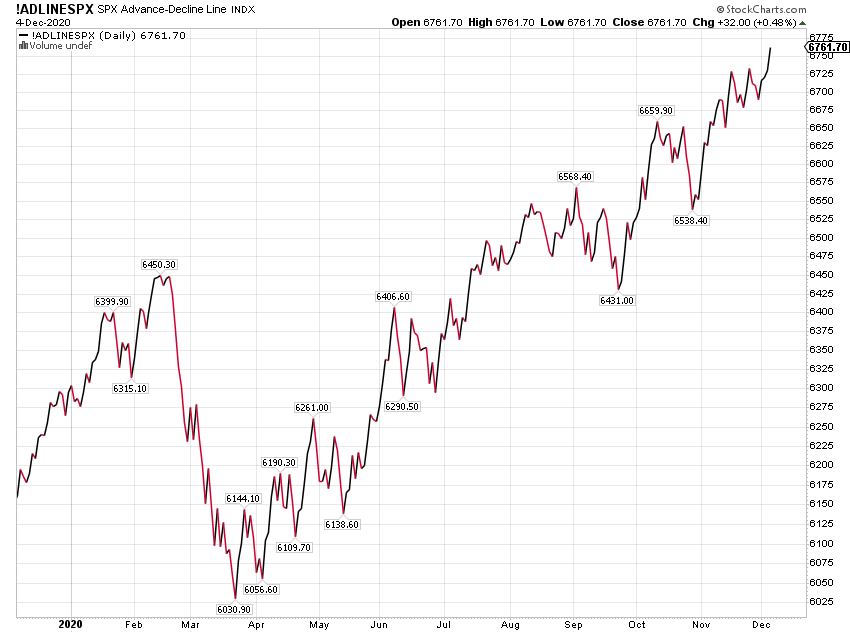 ADLINESPX Daily Chart
The gains were broad based with a record number of stocks participating in the rally.
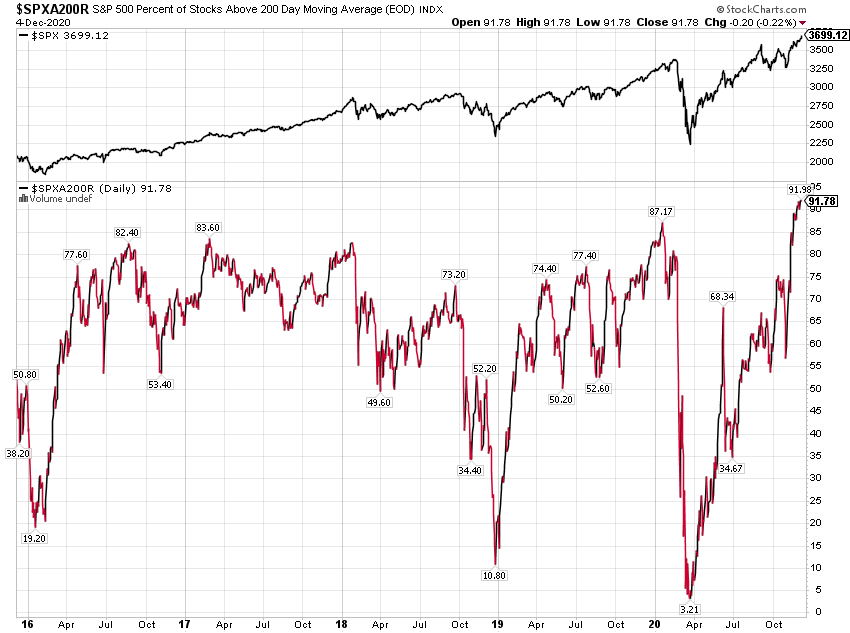 SPX A/D LINE Daily Chart
While over 91% of the companies in the index trade above their 200 day moving average. A more than 5 year high.
The people telling you this bull market has only been because of a handful of tech stocks are completely missing the point. Yes, in a market cap weighted index, the biggest stocks will account for a larger percentage of the gains. It’s always been this way and it will always be. But that doesn’t mean the other stocks aren’t participating also. Far from it.
We were told the market couldn’t advance without the big tech leadership. Well as of Friday’s close, there was a new all time high in all four major market averages. Meanwhile, with the exception of Google (NASDAQ:GOOGL), the big tech companies currently trade between -8% to -11.5% below their all time highs.
Microsoft (NASDAQ:MSFT) down 8% from all time highs
Apple (NASDAQ:AAPL) down 11.5% from all time highs
Amazon (NASDAQ:AMZN) down 11.0% from all time highs
Facebook (NASDAQ:FB) down 8.2% from all time highs
Yet here we are.
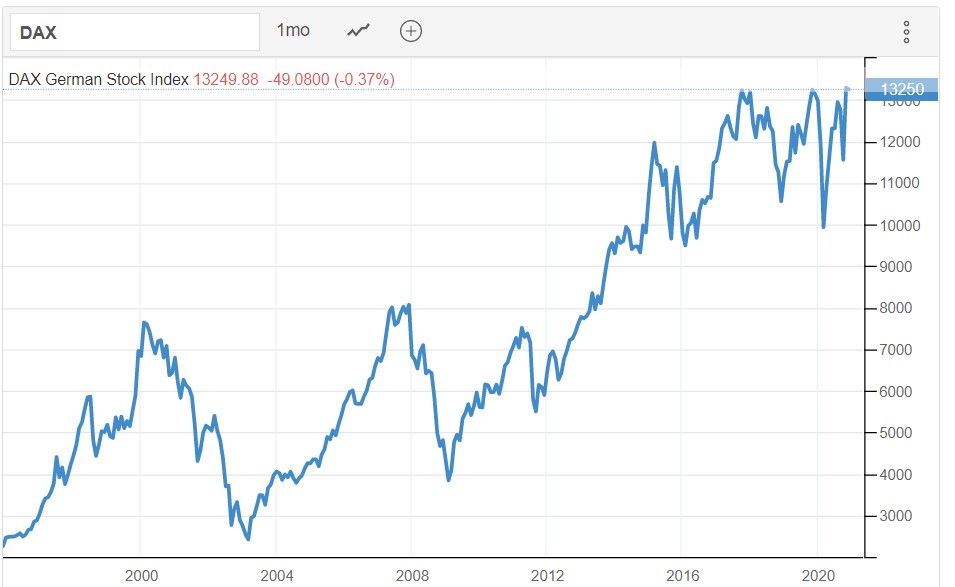 DAX Index Chart
And its not just us. Germany is nearing an all time high.
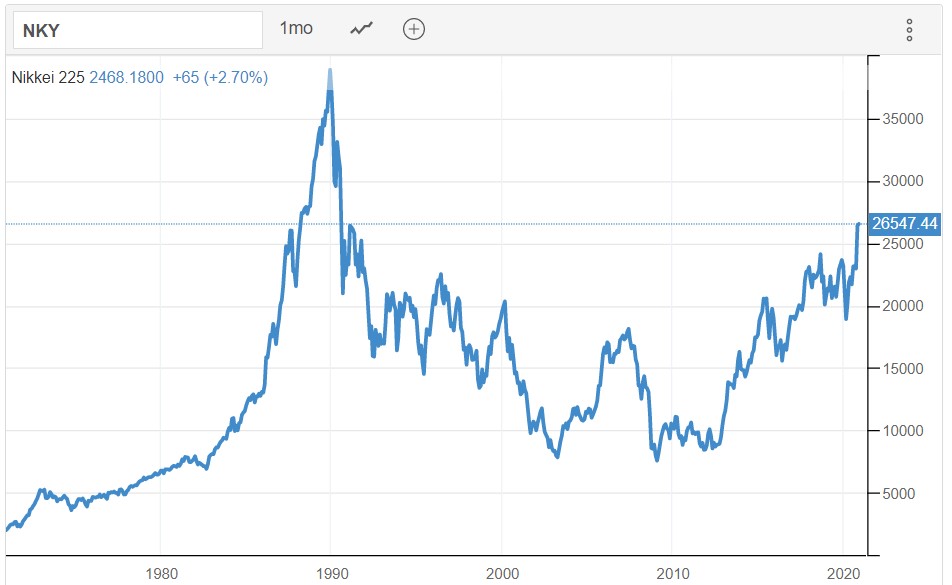 Nikkei 225 Index Chart
While Japan is at a 30 year high (yet still down 40% from 1990 highs, yikes!).
Now 2/3rds of the way through Q4, current Q4 GDP estimates at the Atlanta Fed come in at 11.2% (in fairness, most estimates are currently in the 4-5% range). If 11.2% were to be the actual growth rate, that would make a new all time high in GDP.
Summary: Fundamentals continue to support the bull market. Valuation is a bit stretched on a relative basis and the markets have experienced a steep advance. We know nothing goes in a straight line forever. Expect corrections along the way.
Economic data this week consists of the small business optimism survey on Tuesday and inflation numbers on Thursday.
Leave a comment