Land-based and digital gaming company Everi Holdings (NYSE:EVRI) stock is started to get “discovered” by investors looking for exposure in the recovery of casino gaming and acceleration in iGaming legalization. The momentum in digital sports betting and iGaming platforms like Penn National Gaming (NASDAQ:PENN) and DraftKings (NASDAQ:DKNG) is a thriving theme in 2021 as cash strapped states seeking new tax revenue streams.
While the name Everi may not seem familiar, the Company was created out of the merger of two legacy gaming companies, most notably Multimedia Games (formerly listed as MGAM), which was a top competitor to Scientific Games (NASDAQ:SGMS) and International Game Technology (NYSE:IGT). The Company also provides digital wallet and payments platform for both land-based casinos and digital iGaming managements. The momentum is continuing to accelerate with the economic recovery for land-based casinos and the migration of iGaming approvals. Prudent investors looking for exposure into this trend can watch shares of Everi for opportunistic pullbacks to build a position.
Q3 FY 2020 Earnings Release
On Nov. 2, 2020, Everi Holdings released its fiscal third-quarter 2020 results for the quarter ending September 2020. The Company reported operating income of $19.7 million compared to an operating loss of (-$52.7 million) in the prior quarter Q2 2020. Net loss was $0.01 per diluted share versus $0.12 profit per diluted share year-over-year YoY. The improvement from Q2 2020 was highlighted in the report showing adjusted EBITDA rising to $59.8 million versus $3.3 million in Q2 2020, but below the $67.7 million YoY. Free cash flow improved to $22.8 million in Q3 as the Company repaid its entire $35 million revolver. The Company ended with $235.4 million in cash and cash equivalents at the end of the quarter.
Everi CEO Michael Rumbolz summed it up,
“The significant sequential improvement in revenue, net income, Adjusted EBITDA and Free Cash Flow in the third quarter demonstrates a quicker than previously expected recovery to our results.”
He added:
“The installed base of our gaming operations premium units increased YoY by 40% in the quarter, largely reflecting a return to the strong, pre-pandemic performance levels of our active units.” The Company saw cash access funding transactions and “significant year-over-year increase in sales of our self-service kiosks.”
Raised Q4 Guidance
On Jan. 26, 2021, Everi issued a surprise Q4 2020 top-line guidance raise for the quarter ending December 2020. The Company sees revenues between $117 million to $121 million versus the $115.26 million consensus analyst estimates. Losses for Q4 are expected in the range of (-$1.4 million to -$0.03 million) versus YoY net losses of (-$4.1 million). Adjusted EBITDA will range between $60 million to $62 million compared to $63.2 million YoY.
Acceleration of iGaming
The legalization of online gambling, now referred to as iGaming is still relegated to individual states. On Jan. 29, 2021, the state of Michigan became the third state in the U.S. to approve iGaming, behind New Jersey and Pennsylvania. Pennsylvania and New Jersey are seeing triple digit month-over-month gains from iGaming. Consolidated properties are also finding ways to integrate jackpots through interstate liquidity pools. Ultimately, the movement towards federal legalization would be the ultimate jackpot for iGaming companies. With each state that approves iGaming, stocks in the industry experience spikes. Everi has just reached it 2021 pre-COVID levels but still far behind rivals IGT, SGMS and GAN (NASDAQ:GAN). Prudent investors can watch for opportunistic pullbacks for entries.
 Everi Holdings Inc Stock Chart
EVRI Opportunistic Pullback Levels
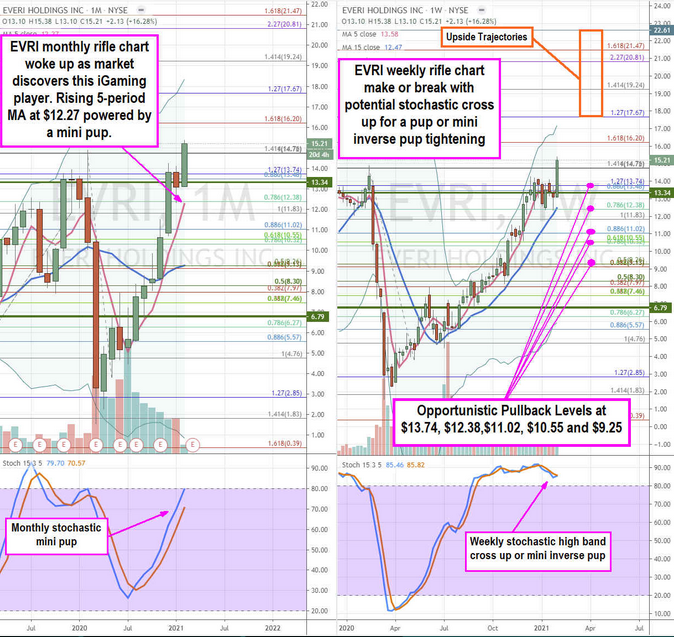
Using the rifle charts on the monthly and weekly time frames provides a broader view of the playing field for EVRI shares. The monthly rifle chart formed a mini pup breakout on the break through the $9.26 Fibonacci (fib) level. with a rising 5-period moving average (MA) support at the $12.38 fib and upper Bollinger Bands at $18.34. The weekly rifle chart has been climbing since triggering the monthly market structure low (MSL) above $6.79 and a daily MSL trigger back above $13.34. The near-term price spike is expensive as measured by the above 80-band weekly stochastic, but on a wider time frame basis, shares are just recovering to pre-COVID 19 levels. Prudent investors can monitor opportunistic pullback levels at the $13.74 fib, $12.38 fib, $11.02 fib, $10.55 fib, and the $9.25 fib. Nimble traders looking for a sooner entry can try the $14.78 fib. The upside trajectories range from the $17.67 fib up towards the $22.50s level. It’s prudent to keep an eye on IGT, SGMS and GAN peers to gauge price action for the group.
Leave a comment