“Why is this a big deal?”

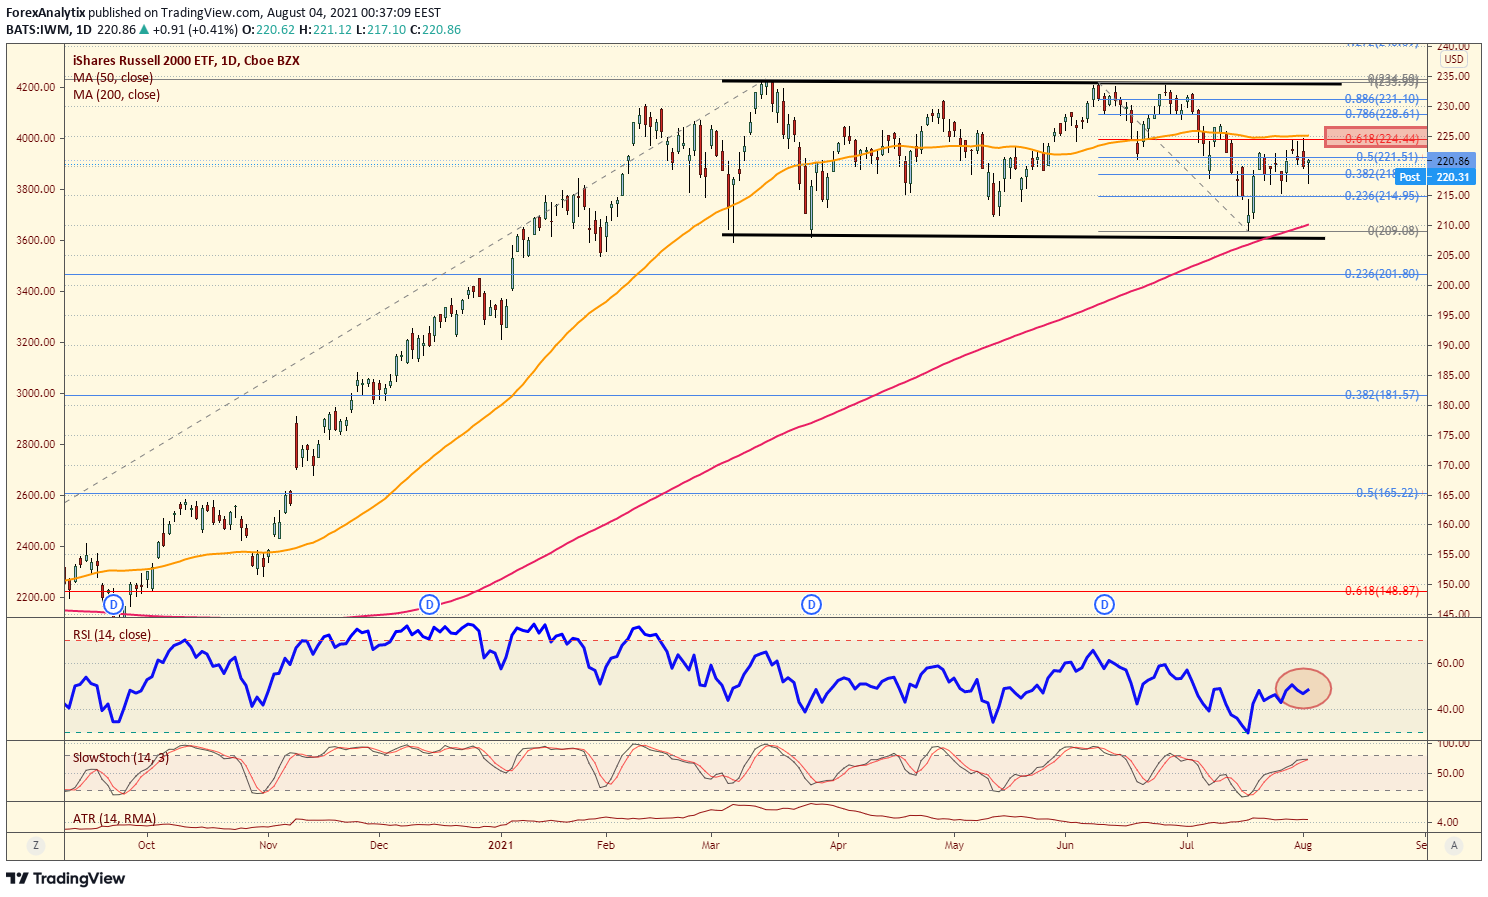
With the almost at all time highs once again, we have to acknowledge the underperformance of this index. We are under the assumption that the SPX will hit new ATH and push towards 4440 then 4495 in the coming days.
What this should allow for is a move in the iShares Russell 2000 ETF (NYSE:) above the 61.8% retracement at the 224.44 level and 50dma back to the “range highs” at 234.
If you want to be long, you know your breakout point and if you want to be short the index, maybe the best risk/reward for a range trade is back at the upper end of the range for a short!
Fusion Media or anyone involved with Fusion Media will not accept any liability for loss or damage as a result of reliance on the information including data, quotes, charts and buy/sell signals contained within this website. Please be fully informed regarding the risks and costs associated with trading the financial markets, it is one of the riskiest investment forms possible.

