KRE Daily Chart
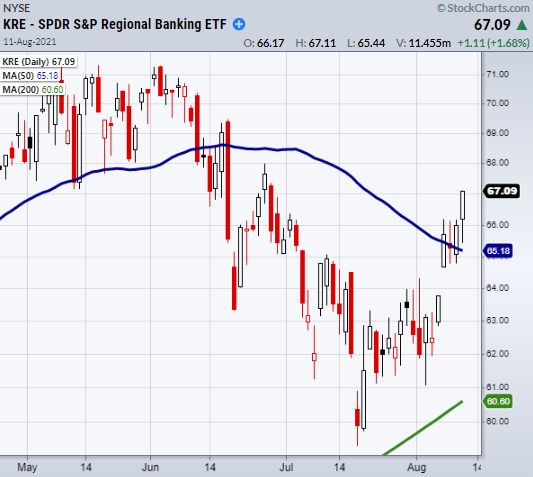
From June to late July, the SPDR® S&P Regional Banking ETF (NYSE:) has been stuck within a downward trend. Coming close to its 200-DMA, it was able to find some support and from there consolidated over the major moving average. With that said, on Aug. 6, KRE gapped higher and closed over its 50-DMA at $65.17.
What caused the gap continues to play a role in the banking sector and for that reason we should keep an eye on both symbols’ pivotal support levels.
The leading cause for the gap higher in KRE happens to be the treasury bonds decreasing and therefore increasing the interest rates.

TLT-Daily Chart
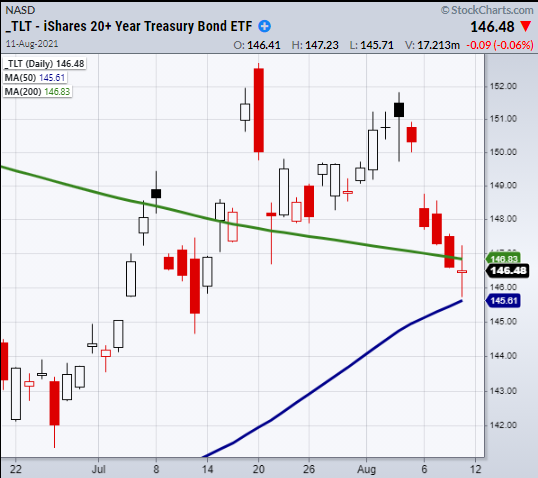
In the chart above you can see the iShares 20+ Year Treasury Bond ETF (NASDAQ:) gapped lower on Aug. 6. The inverse reaction caused KRE to open near its 50-DMA at $65.27, while TLT opened lower and is now close to its 50-DMA at $145.61.
For traders, KRE’s 50-DMA has become an area of support that will need to hold. The rapid rise has also created a breakout from the downward trend and could entice longer-term traders.
However, the main caveat would be if TLT can hold support from the 50-DMA at $145.61. If it does and begins to push upwards, it could erode strength in KRE and create volatile price action.
It should be noted that these major moving averages are commonly watched indicators, and therefore hold more value as levels for symbols to interact with.
While they are not perfect support or resistance levels, they offer a general guide of where traders tend to be more bullish or bearish depending on which side the price is trading on.
ETF Summary
- () Holding highs with very thin range days.
- () Needs to clear resistance at 224.78-225.
- () 351 support.
- () 362 next support area.
- KRE (Regional Banks) Confirmed bullish phase over the 50-DMA at 65.27.
- (Semiconductors) 263.86 support area.
- (Transportation) 258.82 the 50-DMA to clear.
- (Biotechnology) 165.80 support.
- (Retail) Holding 97. 98.50 high to clear.
- Junk Bonds () 108.65 support.
- (Real Estate) 105.22 support area. Inside day.
- (Consumer Staples) 71.69 support area.
- (Trust) 160.68 new support area.
- () 21.53 new support area.
- (S&P Metals and Mining) 45.89 Watching to hold.
- (US Fund) 45.85 support. Looking to test the 50-DMA at 48.85.
- TLT (iShares 20+ Year Treasuries) Tested the 50-DMA 145.61.
- USD () 93.19 resistance to clear.
- (Agriculture) 19.39 gap to fill.
Fusion Media or anyone involved with Fusion Media will not accept any liability for loss or damage as a result of reliance on the information including data, quotes, charts and buy/sell signals contained within this website. Please be fully informed regarding the risks and costs associated with trading the financial markets, it is one of the riskiest investment forms possible.

