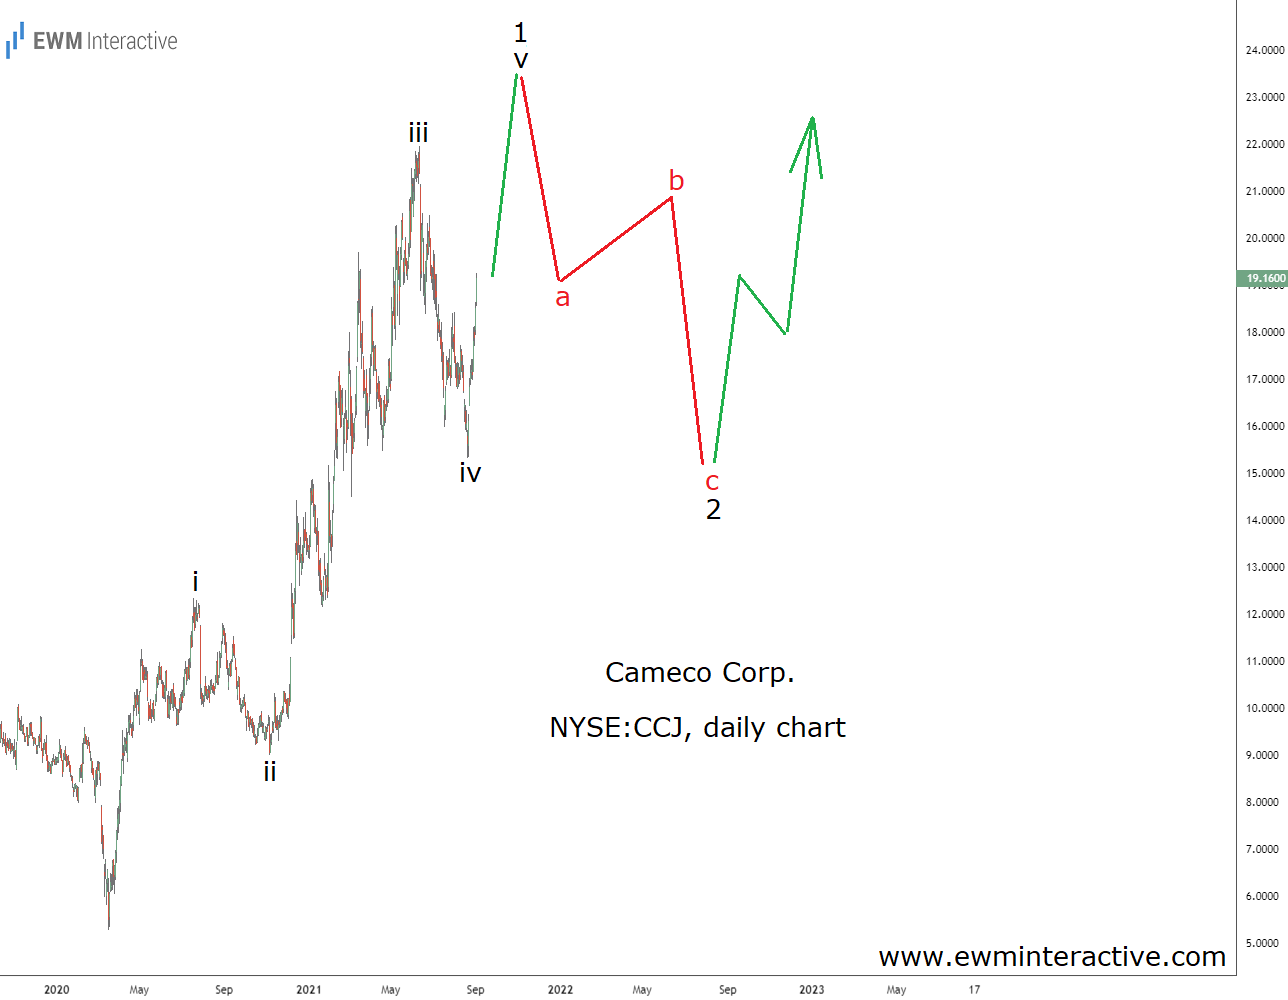
spot prices are on the verge of breaking above $34/lb, up over 80% from the bottom of $18/lb reached in late-2016. Cameco (NYSE:), as one of the world’s top uranium producers, is now seeing its stock price rising in tandem. Yesterday, it closed at $19.16 after reaching $21.95 in June.
We first covered Cameco in February, 2017. The stock was hovering below $11 a share, down 80% from its 2007 all-time high of $56. However, despite that painful decade, the company still seemed in a good financial shape. Considering the stock’s monthly chart, we thought it had a six-fold growth potential in the long term.
CCJ more than doubled over the next four and a half years. That equals to a CAGR higher than 15%. It wasn’t a smooth ride, though, as the COVID panic of March 2020 dragged the stock to a new low of $5.30 first. Fortunately for the bulls, the fundamentals of the uranium market are improving and the company is patiently waiting to take advantage. In addition, the Elliott Wave chart below confirms Cameco has finally turned a corner.

The daily chart reveals an almost complete five-wave impulse, labeled i-ii-iii-iv-v. The fifth wave hasn’t exceeded the top of wave iii yet, so it makes sense to expect a new high near $23 – $25 a share. Soon after that, a three-wave correction in wave 2 back to the support of wave iv should occur.
The point is that impulses develop in the direction in which the larger trend is going. An impulsive recovery means that once wave 2 is over, much higher levels can be expected. Wave 3 is usually longer than wave 1, which puts targets above $40 a share on the table. This count allows us to reaffirm our long-term positive outlook for Cameco stock.
Besides, it is becoming increasingly clear that the world can’t solve climate change without nuclear power. For Cameco, that is a huge opportunity to capitalize on.
Fusion Media or anyone involved with Fusion Media will not accept any liability for loss or damage as a result of reliance on the information including data, quotes, charts and buy/sell signals contained within this website. Please be fully informed regarding the risks and costs associated with trading the financial markets, it is one of the riskiest investment forms possible.

