The about 3i (LON:) was in late-October 2019. The stock was hovering around 1100 pence a share following a 1000% gain in the past ten years. Needless to say, few thought a major decline was even possible. Fortunately, Elliott Wave analysis helped us see the bulls cannot be trusted. Five months later, by March 2020, 3i stock had erased four years’ worth of gains.
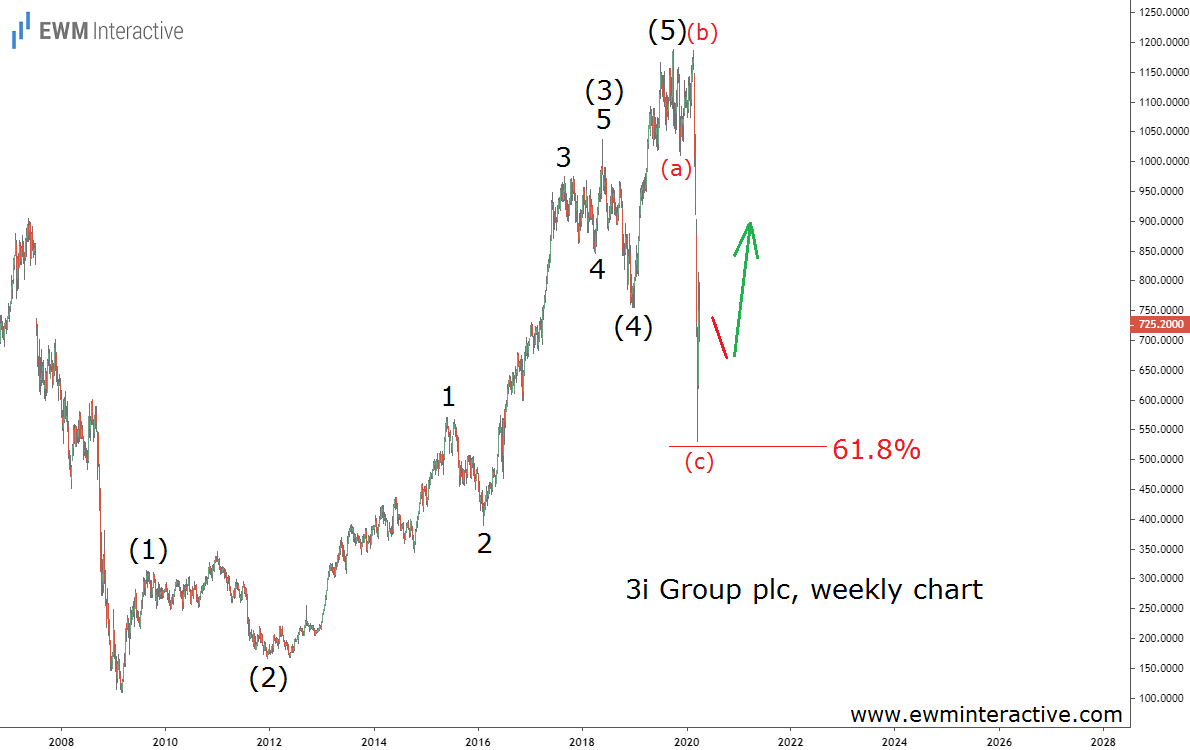
And while markets worldwide were crashing at an unprecedented pace, 3i stock’s chart was actually flashing a buy signal. The sharp COVID-19 selloff completed the 5-3 Elliott Wave cycle in progress since the bottom in 2009. This, in turn, meant the preceding uptrend was supposed to resume.
We shared the chart above with our readers . Instead of running for the exits like everyone else, we thought it was time for another contrarian bet. 3i stock had just bounced of the 61.8% Fibonacci level and was trading at 725 pence a share.
Catching Most of the Surge in 3i Stock
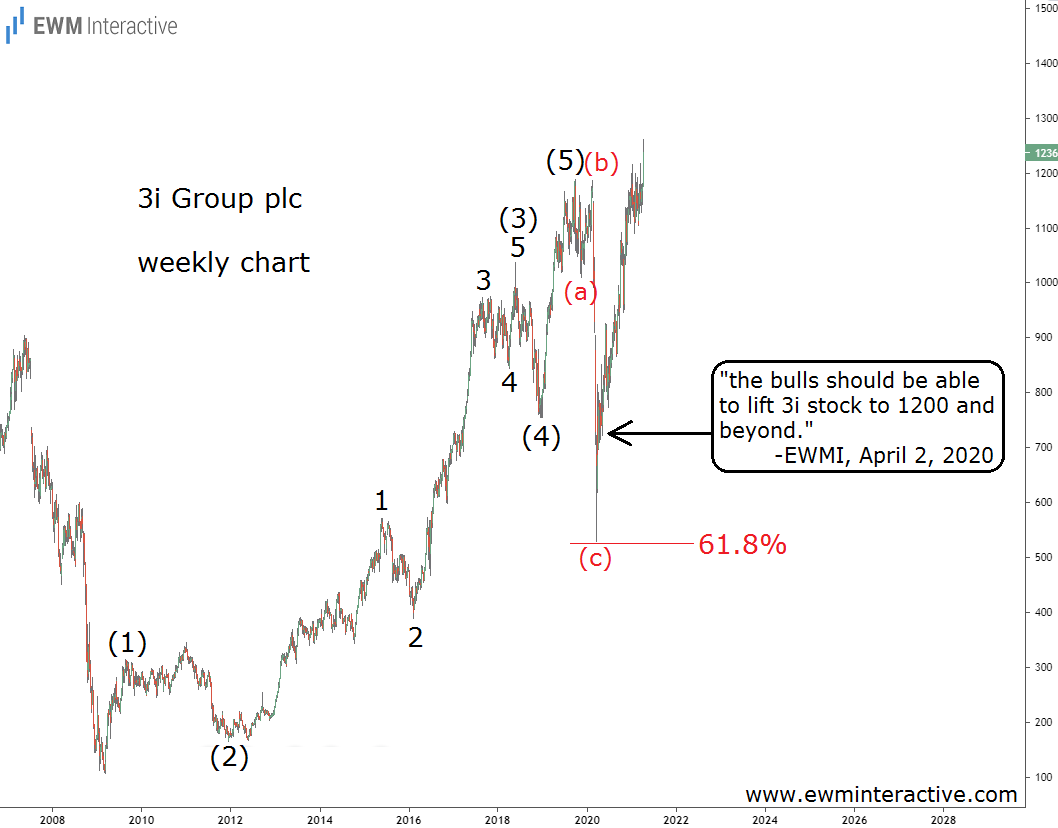
The entire price structure since the Financial Crisis low made us think “the bulls should be able to lift 3i stock to 1200 and beyond” in the long run. A five-wave impulse, followed by an (a)-(b)-(c) correction. In that case, though, the long run turned out to be just a year later.
Actually, 3i exceeded 1200 as early as January 2021. As of this writing, the stock trades near 1240, up 134% from its March 2020 low and 71% since we turned bullish on it.
Now, with central banks taking the term “easy money” to a whole new level, how high can 3i stock go is anyone’s guess. Rock bottom interest rates and record liquidity are generally a blessing for private equity companies like 3i Group.
On the other hand, the fact that it plunged 92% between 2000 and 2009 shows that when liquidity dries up, 3i stock suffers more than most other companies. Investors thinking about joining the bulls now must make sure they have a deep understanding of the company and the industry. In our opinion, the easy money has already been made.
Fusion Media or anyone involved with Fusion Media will not accept any liability for loss or damage as a result of reliance on the information including data, quotes, charts and buy/sell signals contained within this website. Please be fully informed regarding the risks and costs associated with trading the financial markets, it is one of the riskiest investment forms possible.


