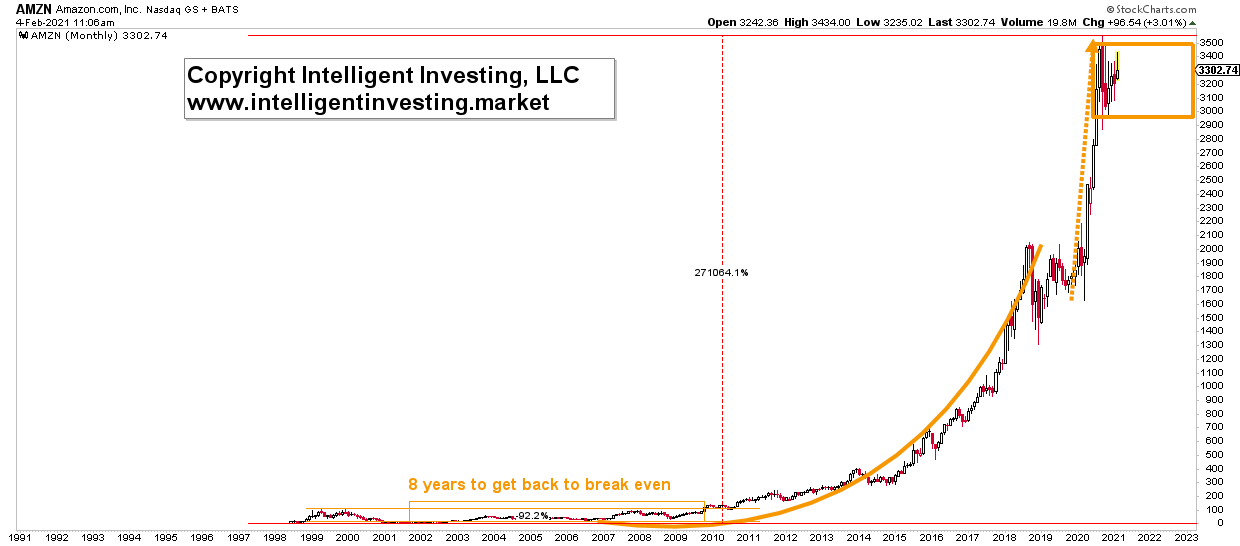
Since its IPO in 1998, Amazon.com Inc (NASDAQ:AMZN) has gained more than 27,100%. Let that sink in.
But was buy and hold the preferred strategy and without any scary ups and downs?
Not at all. Amazon had lost 95% of its value at the 2001 low. Let that also sink in.
It then took eight years to get back to break-even from its all-time High (ATH) made in 2000. Let that sink in, too. Thus, one had to sit through a terrifying time and wait many more years to get back to where things were. That is dead time and money.
Figure 1. Amazon monthly candlestick chart:
 Amazon Monthly Chart.
Ever since that low, gains have been indeed astronomical, and Amazon has had two parabolic phases. Can we expect the third one? Can we expect another 27,000% gain? Or, even another run of +100% like it experienced since March last year?
Most likely not. The Elliott Wave Principle count (see my previous article) suggests upside is minimal versus downside risk. The orange box shows a horizontal digestion zone for Amazon and a breakout targets ~$3800, while a breakdown would be long-term bearish and targets for starters $2,600. Because, please remember, if a stock has gone through a 95% correction, there is no reason to tell it will not do so again. How long will it then take to get back to break-even? Decades most likely.
Leave a comment