

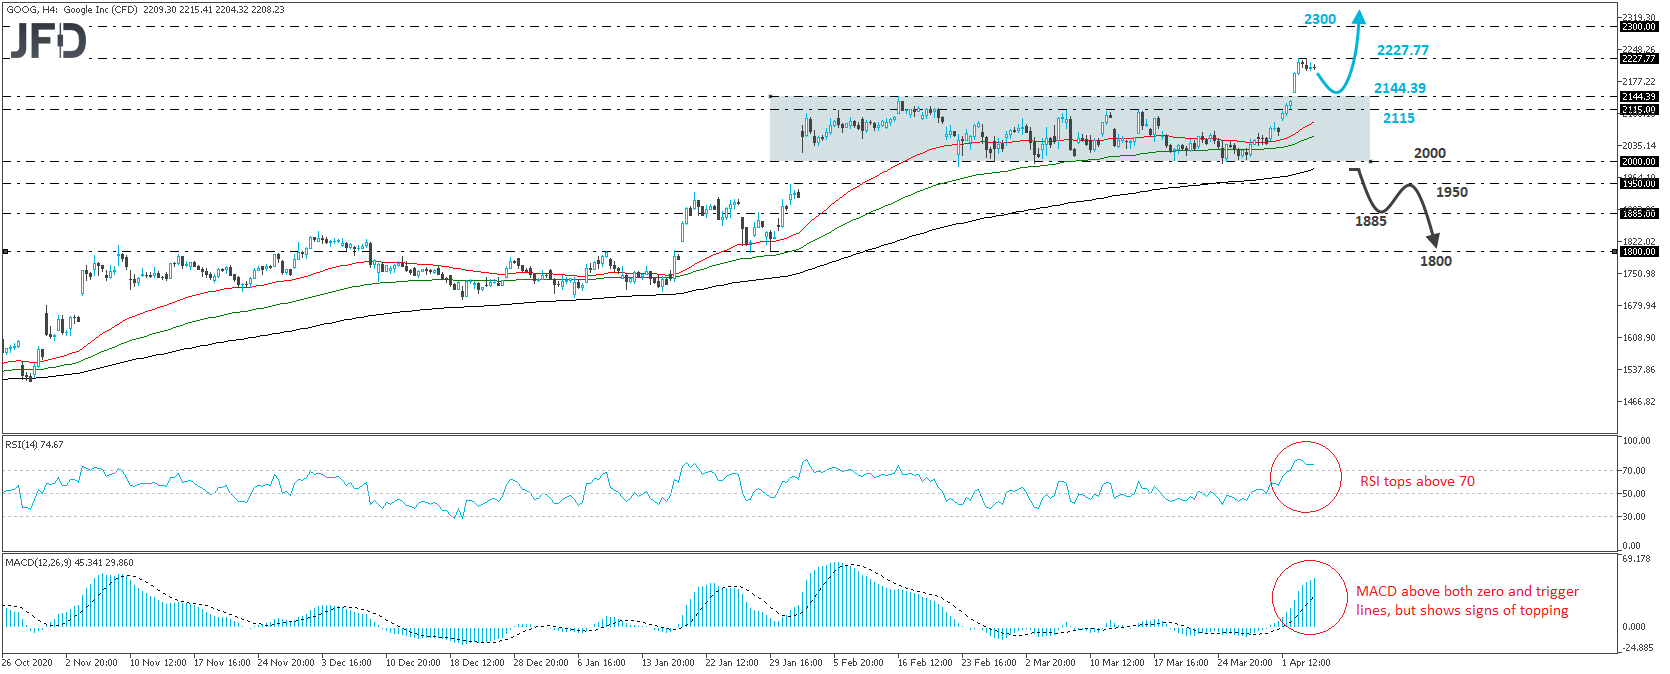
The Alphabet (NASDAQ:) surged on Monday, after opening with a positive gap above its prior record of 2144.39. The stock hit a fresh all-time high at 2227.77 and yesterday, it pulled back somewhat. Monday’s move also signaled the upside exit out of the sideways range that’s been in play since Feb. 3, between the psychological round zone of 2000 and the 2144.39 level. Bearing also in mind that the broader trend has been to the upside since March of last year, we would expect more advances.
A clear break above 2227.77 would take the stock into uncharted territory and perhaps aim for the next psychological zone, at 2300. If market participants are not willing to stop there, we may experience extensions towards the 2400 area. However, given Monday’s steep rally, we could see yesterday’s setback extending for a while more, perhaps for the price to test the 2144.39 level as a support this time.
Looking at our short-term oscillators, we see that the RSI topped above its 70 line, while the MACD, although above both its zero and trigger lines, shows signs of topping as well. Both indicators detect slowing upside speed and support our view that some further retreat may be on the cards before the next leg north.
In order to start examining the bearish case, we would like to see a dip below the aforementioned range’s lower bound, at 2000. Such a move would confirm a forthcoming lower low on the daily chart, and may initially target the 1950 zone, marked by the high of Feb. 2. Another break, below 1950, could see scope for declines toward the 1885 hurdle, marked by the inside swing high of Jan. 28, the break of which could set the stage for the 1800 area, defined as a support by the lows of Jan. 27 and 29, as well as by the inside swing high of Jan. 8.
Fusion Media or anyone involved with Fusion Media will not accept any liability for loss or damage as a result of reliance on the information including data, quotes, charts and buy/sell signals contained within this website. Please be fully informed regarding the risks and costs associated with trading the financial markets, it is one of the riskiest investment forms possible.