
The Alibaba (NYSE:) traded lower this week, after hitting resistance last Tuesday at the crossroads of the 280.00 level and the prior uptrend line drawn from the low of March 23rd. Although the stock has yet to confirm a forthcoming lower low, the fact that it continues to trade below that line keeps the near-term outlook somewhat negative in our view.
A clear and decisive dip below 252.00 would not only confirm a forthcoming lower low, but would also take the share below the 200-day EMA, something that may initially pave the way towards the 241.00 barrier, which provided support between July 14th and 24th. If that barrier doesn’t hold, we may see a test near the inside swing high of June 24th, at 231.50, the break of which could carry larger bearish extensions, perhaps towards the 212.00 area, which stopped the price from moving lower on June 29th and 30th.
Shifting attention to our daily oscillators, we see that the RSI turned down after hitting resistance at 50, while the MACD, although above its trigger line, lies within its negative territory and has also turned south. It could fall below its trigger line soon. Both indicators detect downside speed and support the case for some further declines in this stock.
Now, in order to start examining the bullish case, we would like to see a strong rebound back above the peak of November 9th, at 304.00. Such a move would also confirm the stock’s return above the aforementioned uptrend line and may pave the way towards the all-time record, at 319.30, hit on October 27th. If investors are not willing to stop there, then they will drive BABA into unchartered territory, with the next possible resistance perhaps being near the 330.00 area.
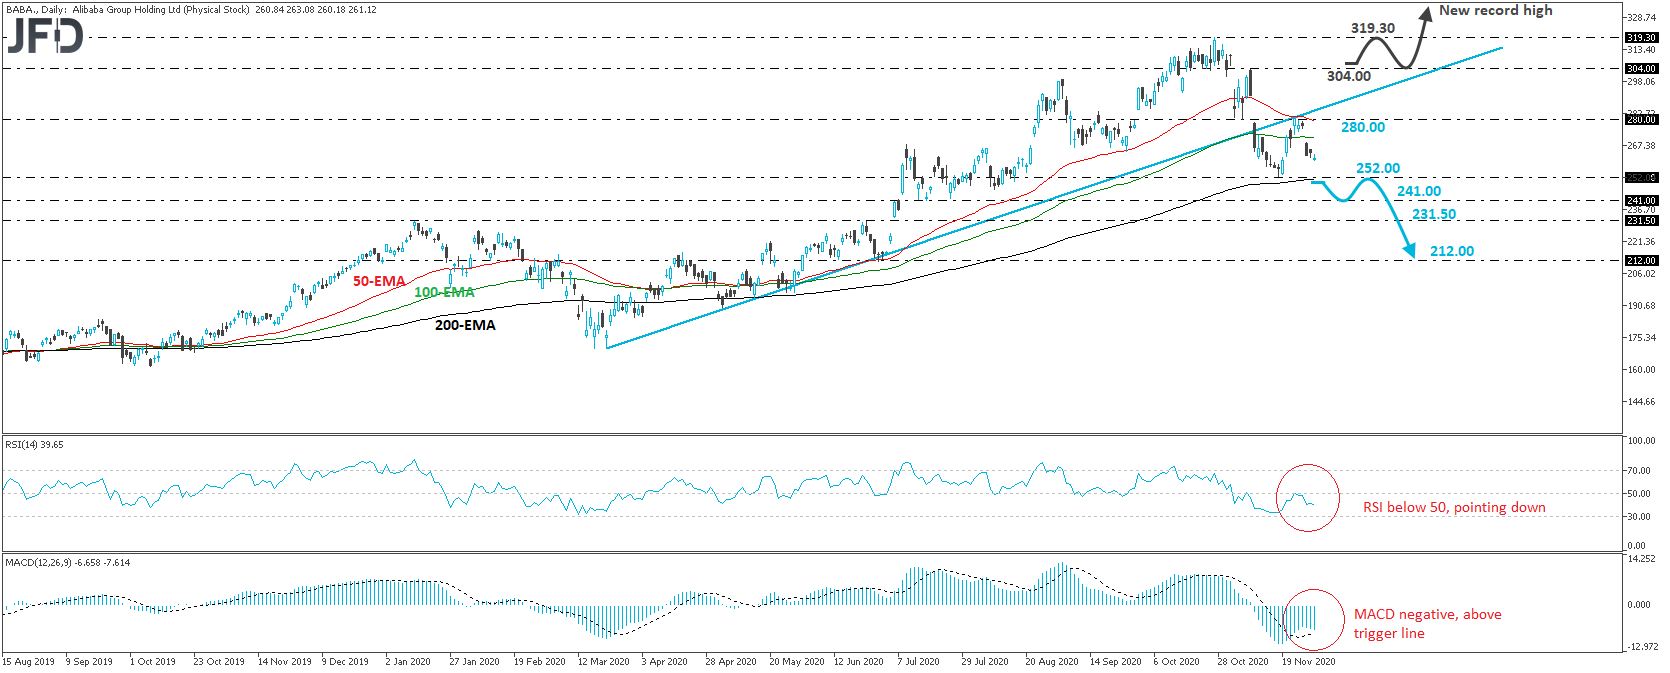 Alibaba stock daily chart technical analysisOriginal Article