Some days markets move, some days they don’t—Wednesday was one of those latter days.
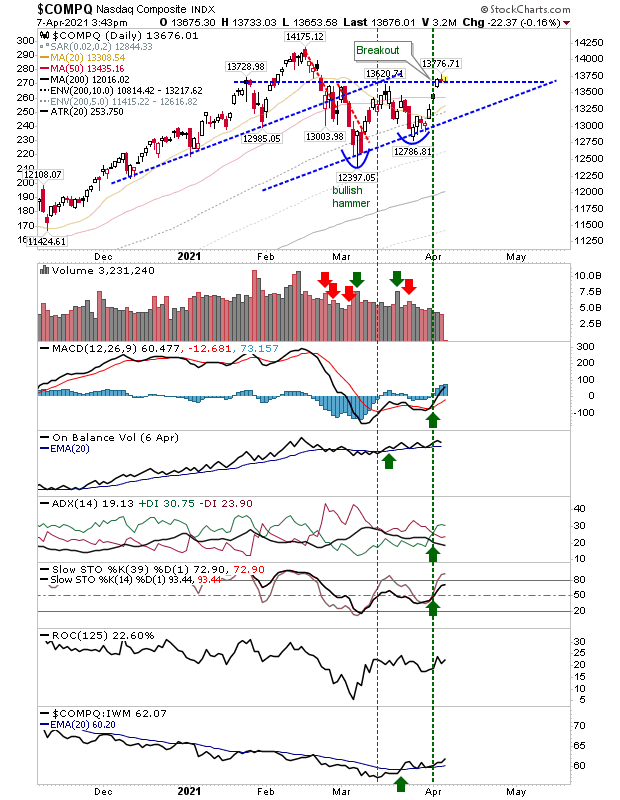
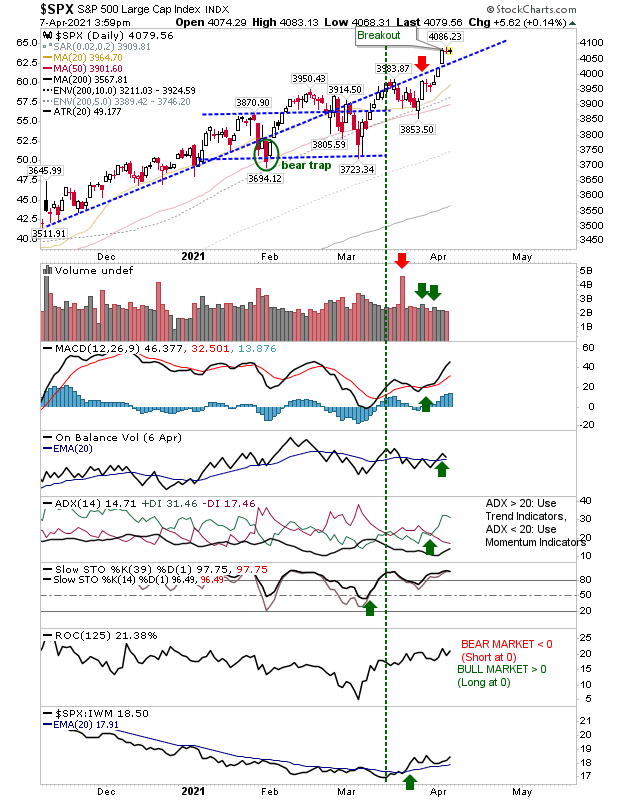
There wasn’t much going with yesterday’s index action, with cryptocurrencies hogging the headlines. The remained on breakout support.

COMPQ Daily Chart
The remains at the upper part of Monday’s breakout range. Technicals are net positive, and the index is well positioned to gain.

SPX Daily Chart
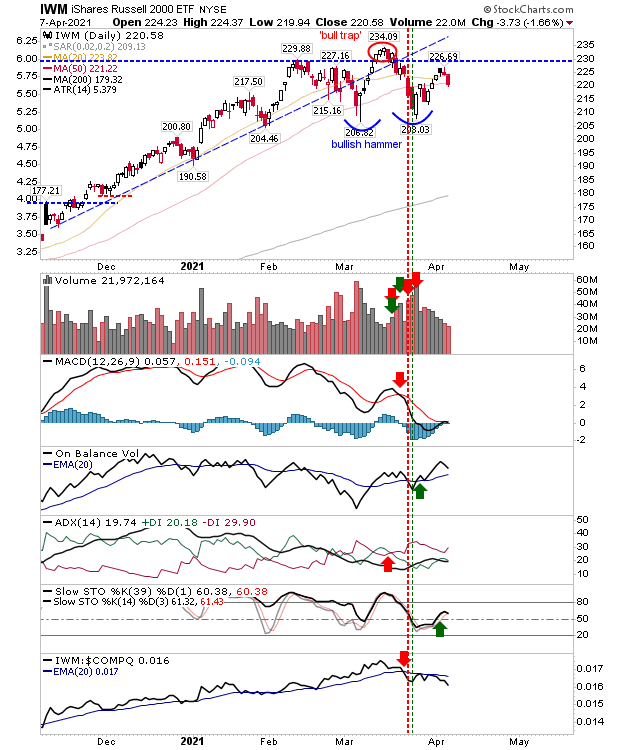
The (via ) lost ground, sending the index back to its 50-day MA. The index still has to challenge the ‘bull trap’ and relative performance against the NASDAQ ticked lower. While it’s the weakest of the lead indices, selling volume was relatively light.

IWM Daily Chart
The index to watch is the Russell 2000. With the S&P at highs, things can stay positive even if the index moves sideways, but should the Russell 2000 continue to trickle losses, it will eventually drag the other indices down with it.
Fusion Media or anyone involved with Fusion Media will not accept any liability for loss or damage as a result of reliance on the information including data, quotes, charts and buy/sell signals contained within this website. Please be fully informed regarding the risks and costs associated with trading the financial markets, it is one of the riskiest investment forms possible.

